New Portfolio Construction in Portfolio app
Forecast fund returns from existing and planned investments in Portfolio, using Monte Carlo simulations to explore outcome ranges and follow-on reserves.
October 5, 2026

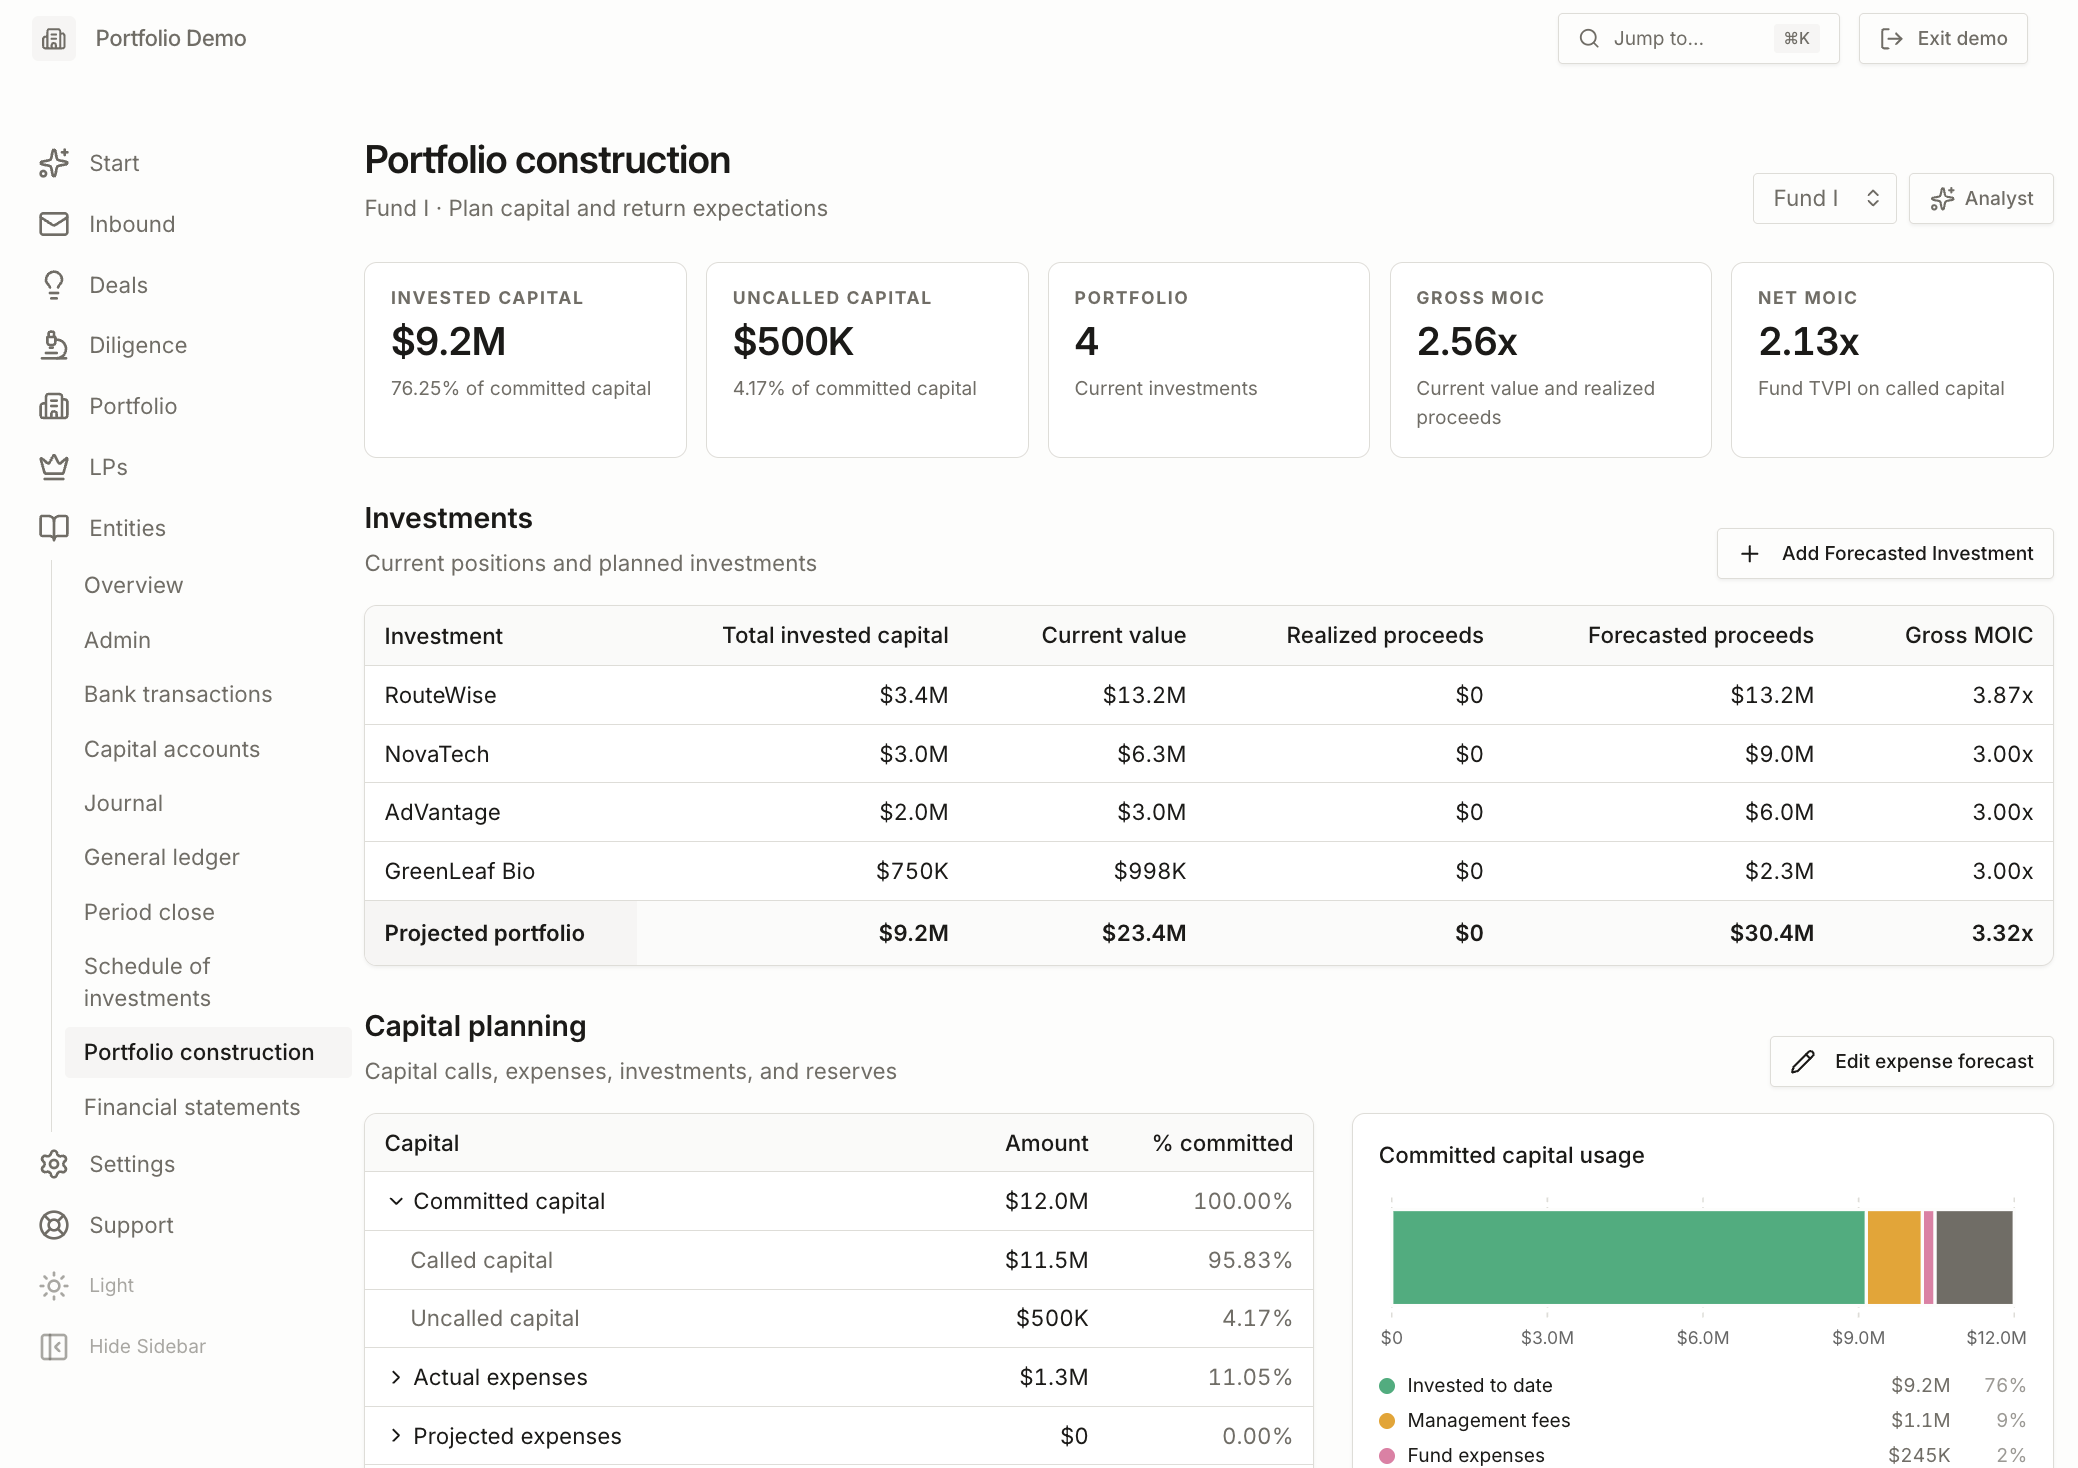
The updated portfolio construction tab in the Portfolio app allows you to use your existing portfolio, forecast additional investments, and model returns using a Monte Carlo style simulation to show a range of fund outcomes instead of a single deterministic number.
The value is in connecting the portfolio you have today to the decisions you still need to make. Current marks tell you where the fund stands, but planning the remaining investments requires assumptions about what happens next. Having the forecast alongside your actual investments makes it easier to revisit those assumptions as the portfolio develops, and see how much your expected return depends on a few companies doing very well.
What's new:
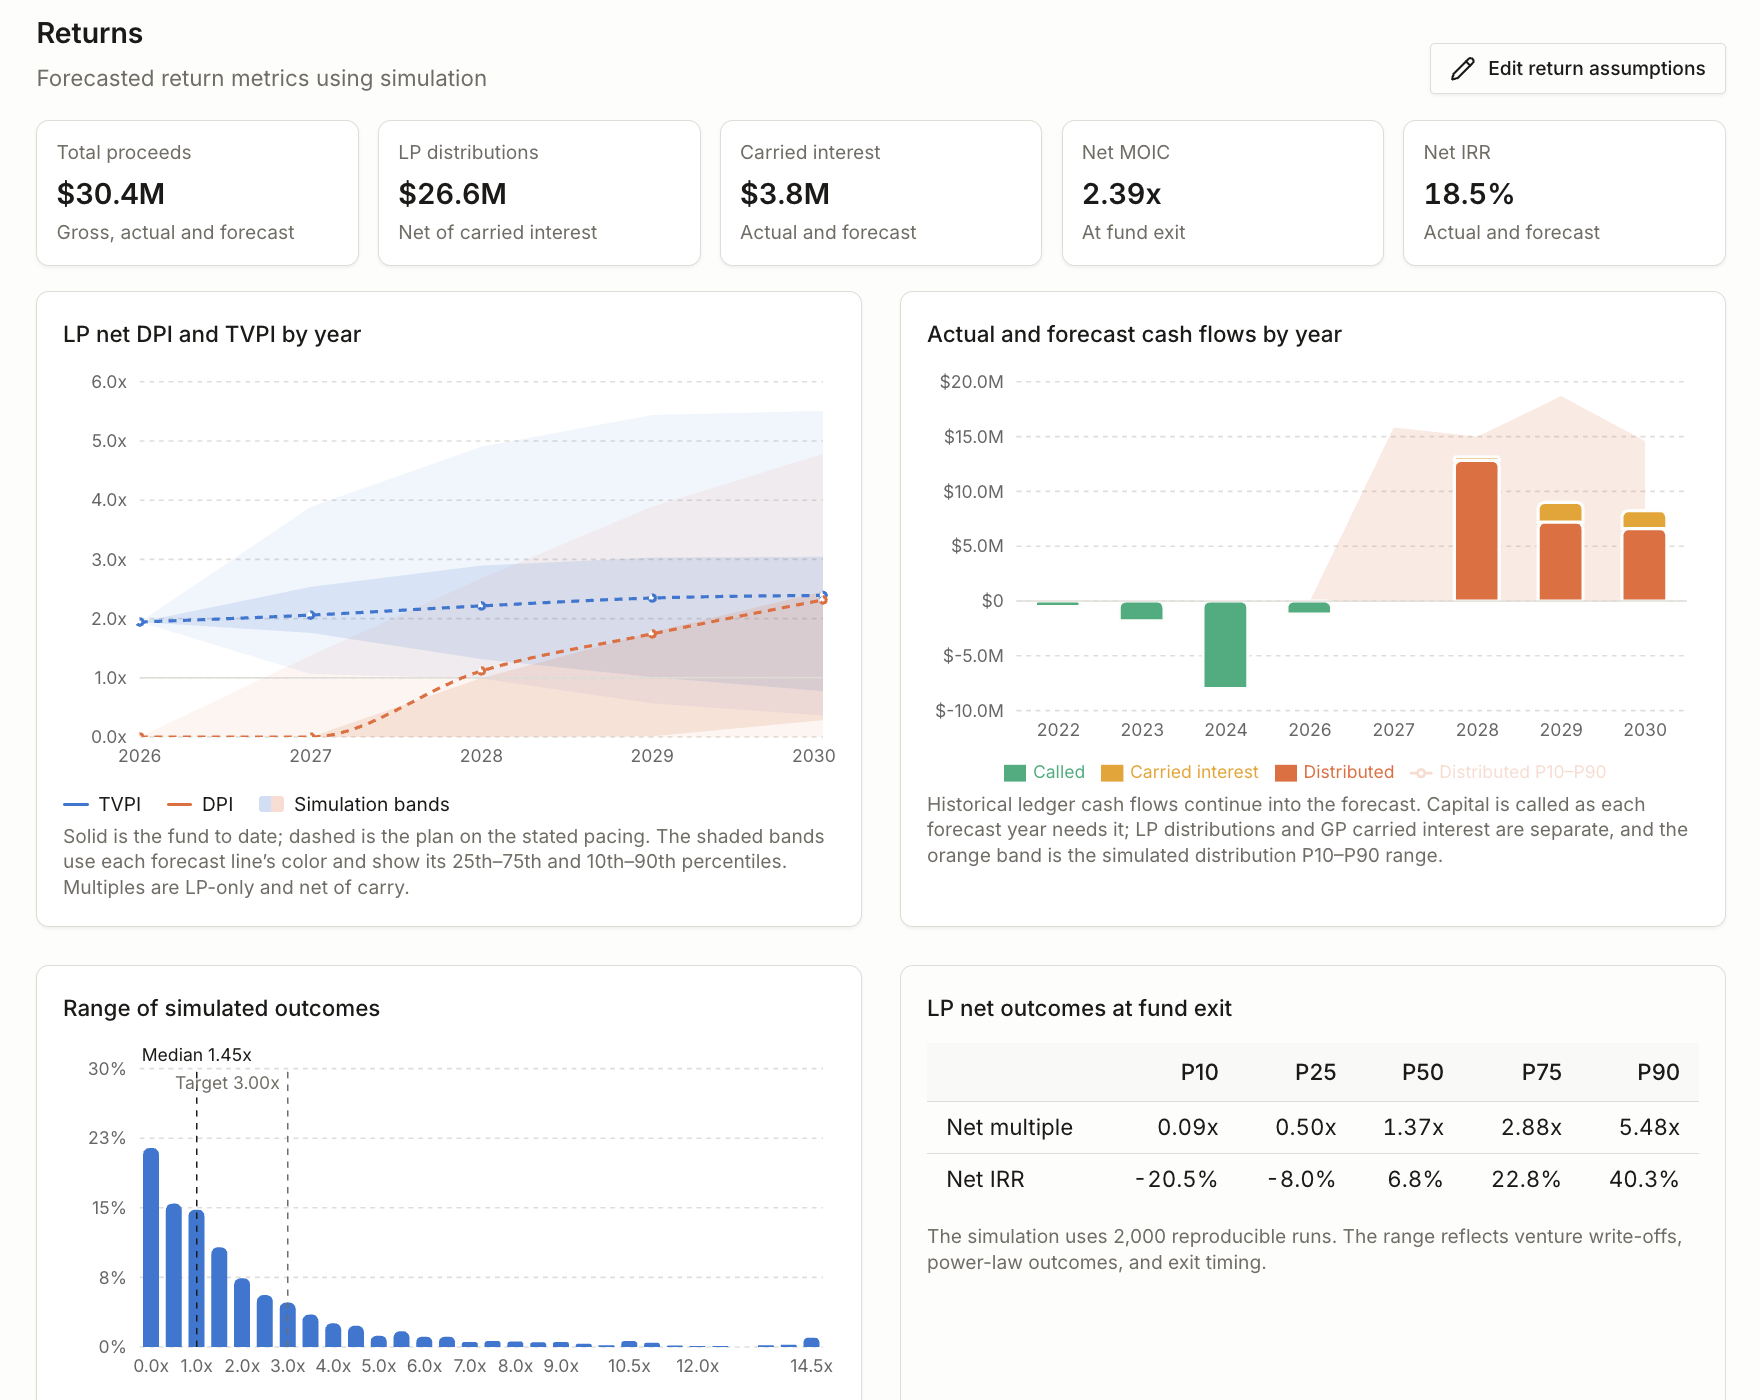
- Forward simulation on the construction sheet. Set your number of investments, check sizes, reserve ratio, and the outcome distribution per deal (loss, return of capital, small multiple, breakout). The sheet runs trials across those assumptions and returns a distribution of gross and net fund outcomes rather than one point estimate.
- Ranges instead of a point. TVPI, DPI, and net multiple now report with percentile bands (p10 / p50 / p90) so you can see how wide the outcomes actually are, which is usually wider than people expect once a single breakout drives most of the return.
- Editable outcome assumptions. The per deal outcome distribution is exposed in labeled cells. Change the hit rate or the breakout multiple and the ranges recompute.
- Reserves modeled explicitly. Follow on reserves are a separate input, so you can test what happens to the distribution when you concentrate reserves into winners versus spreading them.
- Uses your schedule of investments. The current portfolio view, mark to market, and the exports feed straight from the schedule of investments. The forecast sits alongside your actuals, not in a separate file.
A couple of ways you might use it:
- Decide how much capital to hold for follow-ons. Suppose you're partway through investing a fund and weighing a few more initial checks against keeping more capital for existing companies. Add the planned investments, adjust the reserve assumptions, and compare the range of net outcomes. You can see what each plan asks of the portfolio before committing the remaining capital.
- Test the assumptions behind an LP update. Suppose your forecast depends heavily on one breakout investment. Lower its expected outcome and review how the projected proceeds and fund return ranges change. That gives you a concrete way to explain what needs to happen for the fund to reach its target, and how the outlook changes if that company delivers a more modest exit.
The simulation is deliberately light and is not meant to replace a full fund model, but to be a valuable tool to evaluate the potential returns for an existing fund or set of investments you are tracking in the app. If you want the full fund economics with fees, carry, and GP commit broken out, check out the Fund Economics Tool.