Prompt to build a Fund Economics Tool
Fund size, fees and portfolio construction, run by year to LP and GP returns, with three scenarios. Paste the prompt into Claude, ChatGPT or Gemini, answer its questions, and it builds the workbook with the same structure as my Fund Economics Tool.
Or get the finished model
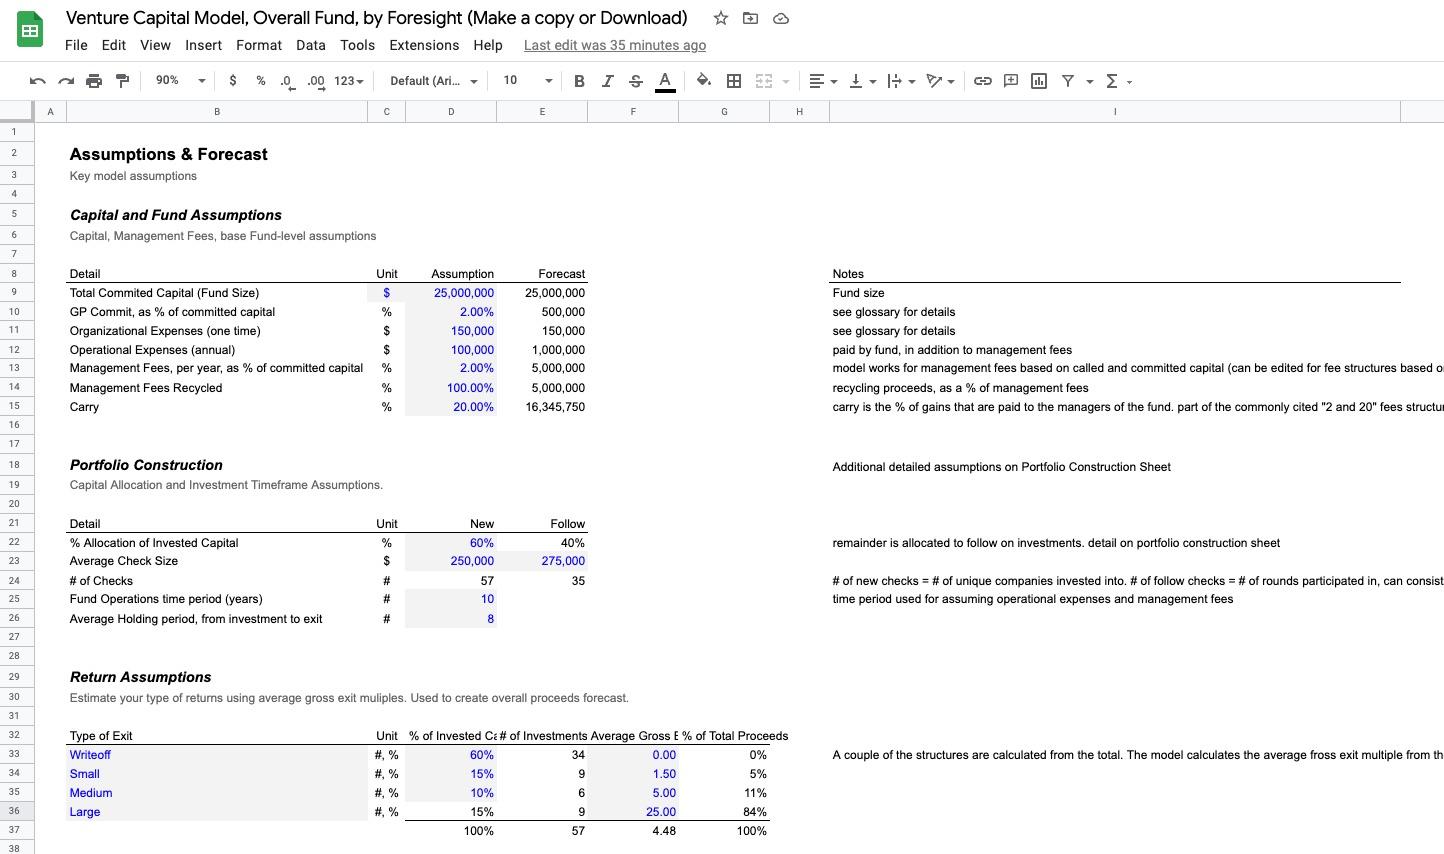
Fund Economics Tool
Built and tested, for Excel and Google Sheets. $20 suggested, pay what you want.
How to use it
You need an AI that hands back a real spreadsheet file, not a description of one. Here’s where that lives in each:
- Claude creates .xlsx files on every plan, free included, and it’s on by default. If it only describes the workbook, open Settings, then Capabilities, and turn on “Code execution and file creation” (called “Create and edit files” in newer versions). On a Team or Enterprise plan your admin controls it.
- ChatGPT has no switch to find. Ask for the workbook as an .xlsx file and it gives you a download link. A paid plan copes better with a model this size.
- Gemini builds working spreadsheets inside Google Sheets: open a blank sheet, click the Gemini icon in the side panel and paste the prompt there. That needs a Google AI Pro or Ultra plan or a Workspace plan with Gemini.
The prompt opens with a few questions about your business. Answer them, or tell it to use the defaults and see the model working before you put your own numbers in.
When it’s done, open the workbook and read the model checks before you trust a number. An AI that builds a model from a prompt still makes mistakes, and the checks are there to catch them. If you want a second pair of eyes on it, that’s what a working session is for.
The prompt
You are an experienced venture fund CFO. Build me a fund economics model in a spreadsheet for a venture fund I'm raising or running. It takes the fund's terms and a power-law view of portfolio outcomes and shows where every dollar of committed capital goes, how the cash moves by year, and what LPs and the GP earn. It's a fund-level model: no individual companies or individual LPs.

## Before you build

Ask me these questions first, in one message, and wait for my answers. If I say "use the defaults", use the defaults below.

1. How big is the fund, what's the GP commitment, and when is the first close?
2. What are the management fee rate and fee period, the carry, and is there a preferred return and catch-up?
3. What are organizational and annual operating expenses, and do you recycle any proceeds?
4. How many years is the investment period, what's your average initial check, and what share of the fund is reserved for follow-ons?
5. What share of capital do you expect to end up in write-offs, small, medium and large outcomes, at what multiples and holding periods?

## Workbook structure

- **Forecast**: inputs at the top, then the fund-level summary, then the yearly cash flows, LP and GP split and metrics.
- **Scenarios**: a conservative, base and high case side by side, driven by two sensitivity inputs.
- **Key Reports**: charts only, plotting rows from the Forecast.

## Inputs

| Section | Input | Default |
| --- | --- | --- |
| Fund | Fund name, currency symbol | Example Fund I, $ |
| | Committed capital (fund size) | $25,000,000 |
| | GP commitment, % of fund, and whether it counts toward invested capital | 2%, yes |
| | First close (year 1 start date) | Jan 1 of next year |
| Costs | Organizational expenses, one time | $150,000 |
| | Operating expenses, per year while the fund runs | $100,000 |
| | Management fee, % of committed capital per year | 2% |
| | Management fee period, years | 10 |
| | Recycled capital, % of committed capital | 10% |
| Waterfall | Carried interest | 20% |
| | Preferred return, annual (0% for none) | 0% |
| | GP catch-up, % of distributions above the pref going to the GP until caught up | 100% |
| Timing | Investment period for new investments, years | 4 |
| | Optional maximum fund life, years (blank for none) | blank |
| Portfolio | % of investable capital for initial checks and for follow-ons | 100%, 0% |
| | Average initial check, average follow-on check | $750,000, $0 |
| Outcomes (four rows: write-off, small, medium, large) | % of invested capital | 60%, 20%, 10%, 10% |
| | Average gross multiple | 0×, 1.5×, 5×, 32× |
| | Holding period, years | 2, 3, 4, 6 |
| Scenarios | % change in the number of large exits, % change in exit values (conservative and high cases) | −50% and −25%, +50% and +25% |

## Fund-level calculations

- LP commitment = fund size × (1 − GP %). GP commitment = fund size × GP %.
- Fund expenses = organizational expenses + operating expenses × the fund's life in years, split between LPs and the GP by commitment.
- Management fees = fee rate × LP commitments for each year of the fee period that the fund is still running. The GP commitment pays no fee. Fees stop when the fund ends, so a fund that ends before the fee period is over pays less.
- Investable capital = committed capital − fees − expenses + recycled capital.
- Number of initial checks = investable capital × initial % ÷ average initial check, and the same for follow-ons.
- Invested capital by outcome tier = investable capital × the tier's %. Number of investments by tier = tier capital ÷ average check. Proceeds by tier = tier capital × the tier's multiple. Show the totals row with the blended gross multiple and capital-weighted holding period.

Fund life is an output, not an input: it's the investment period plus the longest holding period of any capital still invested (the last investment made at the end of the investment period, held for the longest tier's holding period). If a maximum life is set and the derived life would run past it, exits are forced by then; the cap never makes the life longer.

## Yearly cash flows

One column per year from year 1 to the end of the fund's life.

- Investments: spread each year's new investments evenly over the investment period; follow-ons in the years after each initial check.
- Exits: each tier's capital invested in year t returns its proceeds in year t + the tier's holding period (or at the forced exit year).
- Capital calls = investments + fees + expenses in the year, less recycled proceeds used that year. Recycling draws from proceeds until the recycling amount is used.
- Distributions = proceeds not recycled.
- Net cash flow to the fund's investors = distributions − capital calls. Cumulative net cash flow is the J-curve.

## LP and GP split

Split proceeds, and so each year's distributions, between LPs and the GP's own commitment pro rata to each side's invested capital: its called capital, less its share of fees and expenses, plus its share of recycling. Fees fall on LPs only and expenses split by commitment, so the GP commitment ends up with slightly more than its percentage of the fund. The GP's commitment pays no carry, so its share passes straight through. Run a European (whole fund) waterfall on the LP share:
1. Return of LP called capital.
2. Preferred return on called capital, if any, compounding annually.
3. GP catch-up at the catch-up rate until the GP has carry% of all LP profit distributed so far.
4. The rest split carry% to the GP and the remainder to LPs.

Rows by year: distributions to LPs, to the GP as an investor, carried interest, and cumulative carry.

## Metrics

Totals with LP and GP columns: called capital, fund expenses, management fees, recycled capital, invested capital, proceeds, carried interest, distributions; gross multiple (proceeds ÷ invested), net multiple (TVPI, distributions ÷ called), DPI and RVPI (this model ends with everything distributed, so RVPI ends at 0), PIC (paid-in ÷ committed). Gross IRR from the investment and proceeds cash flows, and net IRR for the fund, LPs and GP from the called and distributed cash flows, using XIRR on the year dates. Show net multiple and net IRR by year too, so the J-curve and the interim IRR are visible.

## Scenarios

The conservative and high cases recalculate the whole model with the two sensitivity inputs applied: the large tier's share of capital moves by the % change in large exits (taken from or given to write-offs), and every tier's multiple moves by the % change in exit values. Build this with formulas that reference the base inputs (for example a scenario selector feeding the Forecast, plus a data table, or parallel calculation columns), not by copying sheets of typed numbers. The Scenarios sheet shows gross and net multiples and IRRs for all three cases side by side.

## Key Reports

Charts: capital calls and distributions by year with cumulative net cash flow as a line (the J-curve); where committed capital goes (fees, expenses, investments, recycling) as a single stacked bar; proceeds by outcome tier; net IRR and TVPI by year; the three scenarios compared.

## Model checks

TRUE or FALSE: outcome tier percentages sum to 100%; capital calls never exceed committed capital in total; investments plus fees plus expenses minus recycling equal called capital; LP plus GP distributions equal total distributions; carry is never negative; the fund's life is at least the investment period.

## How the workbook should look and behave

These are my house rules for spreadsheets. Follow all of them.

- Use Arial 12 everywhere, including the workbook's default style. Never Calibri.
- Inputs are blue text (#0000FF) on a light grey fill (#F2F2F2), so they read like form fields. Calculations are black text with no fill. Never use grey text anywhere.
- Every sheet leaves column A blank and narrow. The model starts in column B.
- Column B holds row labels. Column C is a narrow Notes column, about half the width of the label column, holding a short note on what the row is or where it comes from. Let notes clip rather than wrap. Values, or the first period of a timeline, start after the notes column.
- No cell comments. Notes go in the notes column.
- Turn gridlines off on every sheet. Freeze panes on the header rows only, never on columns.
- No borders at all, not even header underlines or subtotal rules. Blank rows and bold text carry the structure.
- Every calculated number is a live formula that traces back to an input. Never type a number into a calculation cell, and never mix typed values and formulas in the same row.
- Keep the number of sheets low. Sheets that share a timeline use the same columns, so a given column is the same month on every sheet.
- Format currency with thousands separators and no decimals, percentages with one decimal place, and dates as "mmm yyyy".
- Name rows in plain words a founder or investor would use, with units in the label where it helps ("Churn per contract cycle, %").

## When you're done

- Recalculate and confirm there are no errors (#REF!, #DIV/0!, #VALUE!, #N/A) and no circular references unless I asked for one.
- Show me the results of the model checks and the headline outputs.
- List every assumption you made that I didn't give you, and the three inputs I should change first.
- If you can't produce an .xlsx file, give me each sheet as a table with the exact label, input value or formula in every cell, so I can rebuild it in Excel or Google Sheets without guessing.