Prompt to build a Cap Table and Exit Waterfall Tool
A priced round with SAFEs, notes and the option pool, then who gets what at each exit value. Paste the prompt into Claude, ChatGPT or Gemini, answer its questions, and it builds the workbook with the same structure as my Cap Table and Exit Waterfall Tool.
Or get the finished model
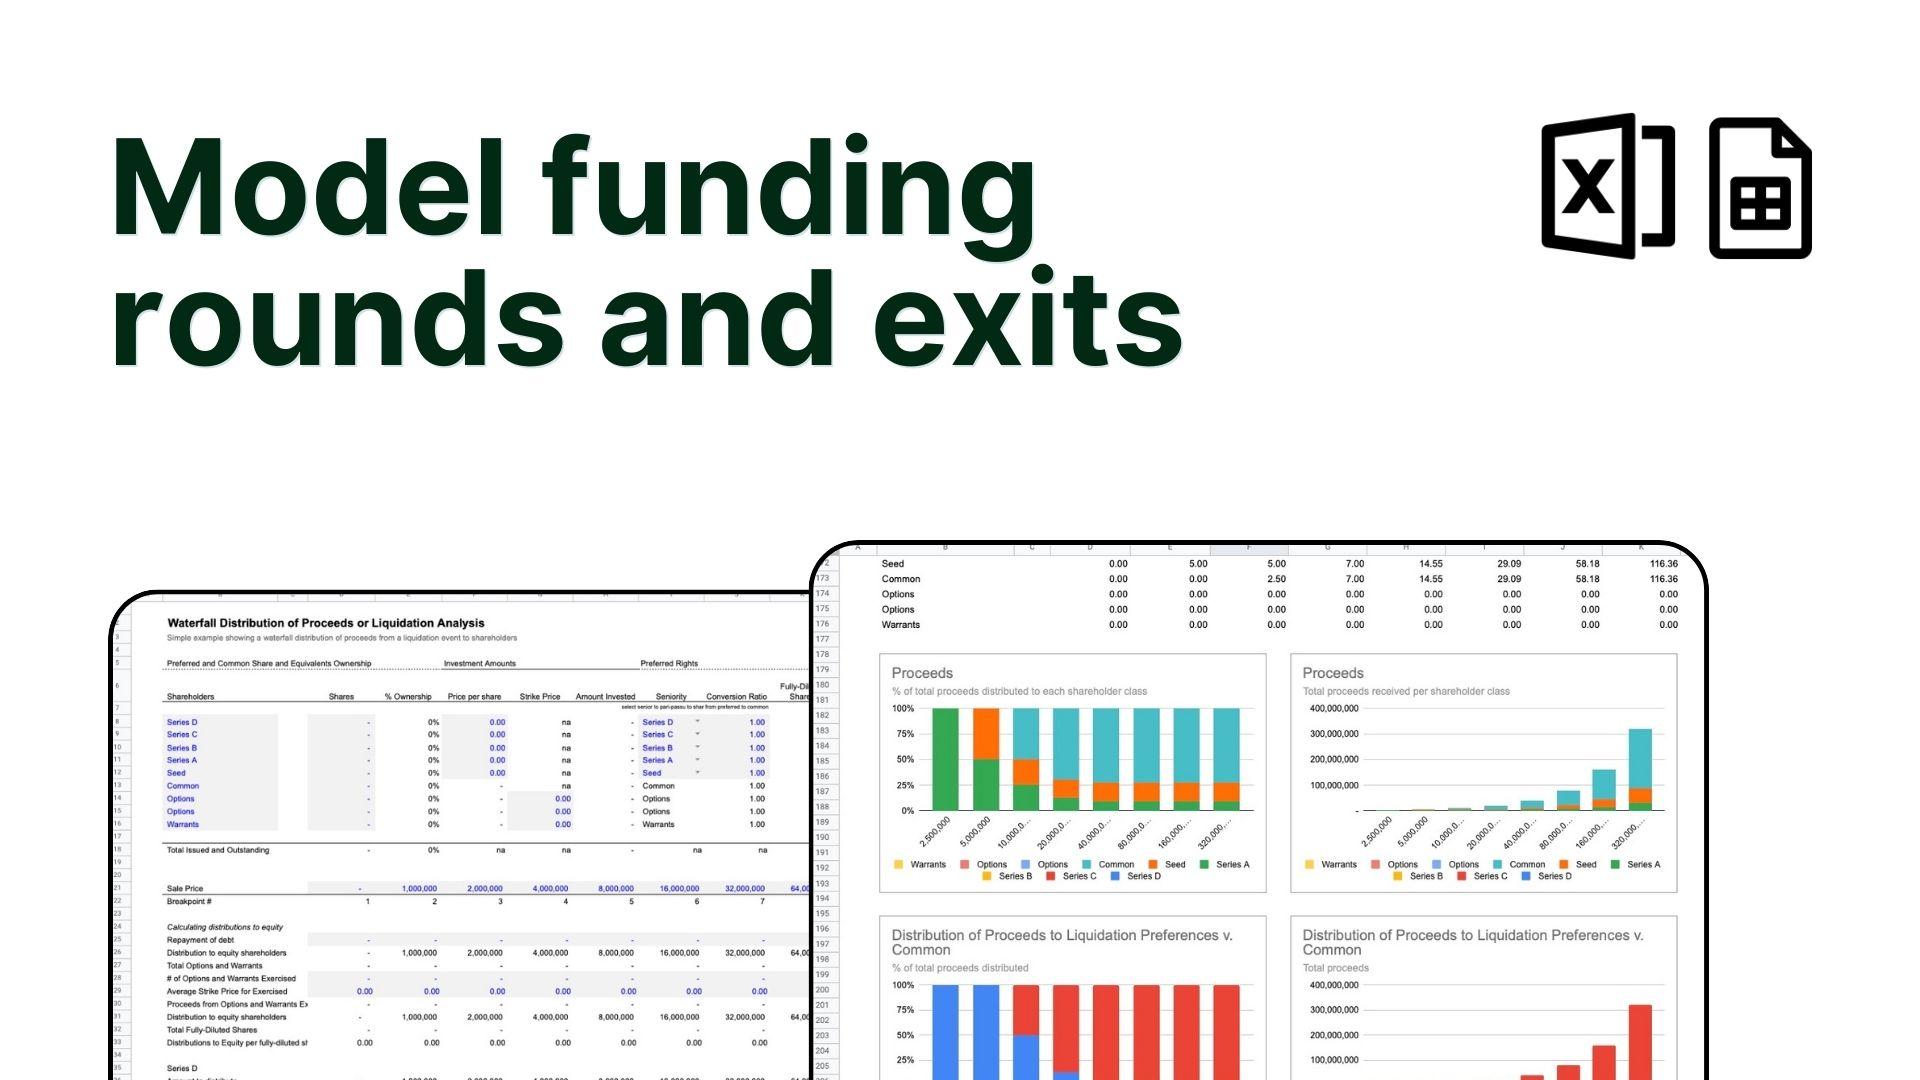
Cap Table and Exit Waterfall Tool
Built and tested, for Excel and Google Sheets and in your browser. $20 suggested, pay what you want.
How to use it
You need an AI that hands back a real spreadsheet file, not a description of one. Here’s where that lives in each:
- Claude creates .xlsx files on every plan, free included, and it’s on by default. If it only describes the workbook, open Settings, then Capabilities, and turn on “Code execution and file creation” (called “Create and edit files” in newer versions). On a Team or Enterprise plan your admin controls it.
- ChatGPT has no switch to find. Ask for the workbook as an .xlsx file and it gives you a download link. A paid plan copes better with a model this size.
- Gemini builds working spreadsheets inside Google Sheets: open a blank sheet, click the Gemini icon in the side panel and paste the prompt there. That needs a Google AI Pro or Ultra plan or a Workspace plan with Gemini.
The prompt opens with a few questions about your business. Answer them, or tell it to use the defaults and see the model working before you put your own numbers in.
When it’s done, open the workbook and read the model checks before you trust a number. An AI that builds a model from a prompt still makes mistakes, and the checks are there to catch them. If you want a second pair of eyes on it, that’s what a working session is for.
The prompt
You are an experienced venture finance analyst who has built many cap tables for priced rounds. Build me a cap table and an exit waterfall in a spreadsheet. The cap table shows ownership before and after a priced round, including SAFEs and notes converting and an option pool top-up. The waterfall shows what every share class takes home across a range of exit values, under the preferences each class negotiated.

## Before you build

Ask me these questions first, in one message, and wait for my answers. If I say "use the defaults", use the defaults below.

1. Who owns the company today: founders and other common holders, options granted and still available, and any preferred rounds already done?
2. Are there SAFEs or convertible notes outstanding? For each: amount, valuation cap, discount, pre-money or post-money SAFE, and for notes the interest rate and start date.
3. What's the new round: amount, pre-money valuation, who's investing how much, and what option pool the investors want after the round?
4. For each preferred class: liquidation preference multiple, participating or not (and any cap), seniority, and conversion ratio.
5. Is there debt to repay at an exit?

## Workbook structure

- **Cap Table**: the pre-round table and the post-round (pro forma) table side by side, with the round's terms below.
- **Conversions**: the SAFE and note conversion math, one row per instrument.
- **Exit Waterfall**: one row per share class, one column per exit value.
- **Key Reports**: charts only.

## Inputs and defaults

Cap table:
- Common holders, one row each: Founder A 5,000,000 and Founder B 5,000,000 shares.
- Options: 0 issued and outstanding, 0 available.
- One pre-money SAFE: $500,000, $8,000,000 cap, 20% discount.
- New round: $2,000,000 total from Investor 1 ($1,500,000) and Investor 2 ($500,000), $10,000,000 pre-money valuation, option pool target 10% of post-money fully diluted.
- Share rounding: round shares down to whole shares.

Waterfall:
- Classes, from the cap table, each with type (Preferred, Common, Options, Warrants), seniority rank (1 = paid first; equal ranks are paid pari passu), amount invested, shares, conversion ratio (default 1.0), price per share or strike, liquidation preference multiple (default 1.0x), and participation (dropdown: Non-participating, Participating, Participating with cap) with the cap as a multiple of invested.
- Debt repaid at exit: $0.
- Exit values: built automatically at each preference breakpoint, then rising in steps to 10× the post-money valuation, with every cell overridable.

## Cap table calculations

Columns for each holder: common shares, preferred shares, options, issued and outstanding shares and %, fully diluted shares and %.

Round mechanics:
- The option pool top-up is part of the pre-money valuation (the "option pool shuffle"): new pool shares are sized so the available pool equals the target % of post-money fully diluted shares.
- Price per share = pre-money valuation ÷ pre-money fully diluted shares, where pre-money fully diluted includes existing shares, the new pool shares and the shares from converting SAFEs and notes. Solve this algebraically in closed form, so the workbook needs no circular references or iterative calculation.
- New investor shares = investment ÷ price, rounded down. Show the actual investment after rounding.
- Post-money valuation = price × post-money fully diluted shares.

Conversions:
- Pre-money SAFE and convertible note: conversion price = the lower of round price × (1 − discount) and valuation cap ÷ pre-money fully diluted shares (excluding the new pool, unless I tell you the documents say otherwise). Notes convert principal plus accrued simple interest to the round date.
- Post-money SAFE: ownership = investment ÷ post-money valuation cap, measured on the post-money capitalization including all converting SAFEs.
- Each converting instrument becomes its own preferred class (a "shadow" series) with a liquidation preference equal to the amount invested, not the conversion value.

## Waterfall calculations

For each exit value:
1. Repay debt.
2. Add the exercise proceeds of in-the-money options and warrants (strike below the per-share value to common) to the amount distributed, and count those shares as common.
3. Pay liquidation preferences by seniority, most senior first, sharing pro rata within the same rank when there isn't enough to cover a rank in full.
4. Distribute what's left to common, to participating preferred (on an as-converted basis), and to non-participating preferred that convert.
5. A non-participating class converts when its as-converted share of the residual beats its preference. A participating class with a cap converts when its as-converted share beats the cap.

Implement the conversion decisions without circular references, using breakpoints: for each class, compute the per-share common value at which converting beats its preference (preference per share ÷ conversion ratio, or cap per share for capped participation), sort those thresholds, and allocate the residual in tranches between them, adding each class to the pool of participating shares once the common value passes its threshold.

Output rows per class: preference paid, participation or common distribution, total proceeds, proceeds per share, % of the exit, and multiple on invested capital.

## Key Reports

Charts: ownership by holder before and after the round (fully diluted), and proceeds by class across the exit values as a stacked area, so the breakpoints where classes convert are visible.

## Model checks

TRUE or FALSE: fully diluted % sums to 100% before and after the round; post-money valuation = pre-money + new investment, within rounding; the available pool after the round equals the target; at every exit value total distributions equal the exit value less debt; no class receives less than zero.

## How the workbook should look and behave

These are my house rules for spreadsheets. Follow all of them.

- Use Arial 12 everywhere, including the workbook's default style. Never Calibri.
- Inputs are blue text (#0000FF) on a light grey fill (#F2F2F2), so they read like form fields. Calculations are black text with no fill. Never use grey text anywhere.
- Every sheet leaves column A blank and narrow. The model starts in column B.
- Column B holds row labels. Column C is a narrow Notes column, about half the width of the label column, holding a short note on what the row is or where it comes from. Let notes clip rather than wrap. Values, or the first period of a timeline, start after the notes column.
- No cell comments. Notes go in the notes column.
- Turn gridlines off on every sheet. Freeze panes on the header rows only, never on columns.
- No borders at all, not even header underlines or subtotal rules. Blank rows and bold text carry the structure.
- Every calculated number is a live formula that traces back to an input. Never type a number into a calculation cell, and never mix typed values and formulas in the same row.
- Keep the number of sheets low. Sheets that share a timeline use the same columns, so a given column is the same month on every sheet.
- Format currency with thousands separators and no decimals, percentages with one decimal place, and dates as "mmm yyyy".
- Name rows in plain words a founder or investor would use, with units in the label where it helps ("Churn per contract cycle, %").

## When you're done

- Recalculate and confirm there are no errors (#REF!, #DIV/0!, #VALUE!, #N/A) and no circular references unless I asked for one.
- Show me the results of the model checks and the headline outputs.
- List every assumption you made that I didn't give you, and the three inputs I should change first.
- If you can't produce an .xlsx file, give me each sheet as a table with the exact label, input value or formula in every cell, so I can rebuild it in Excel or Google Sheets without guessing.