Portfolio Reporting
The first of the four products, and the one nearly everyone starts with: portfolio dashboards, company detail, metric tracking, Asks, and how your portfolio data gets in.
Portfolio Reporting is the first of the four products and the only one on by default. It covers the operating data of the companies you're invested in, which is the layer your fund administrator never touches, and it works on its own without any of the other three.
This covers the portfolio dashboard, the company detail page, investment tracking, how reports get into the system, Asks, the review queue, and team notes.
Portfolio dashboard
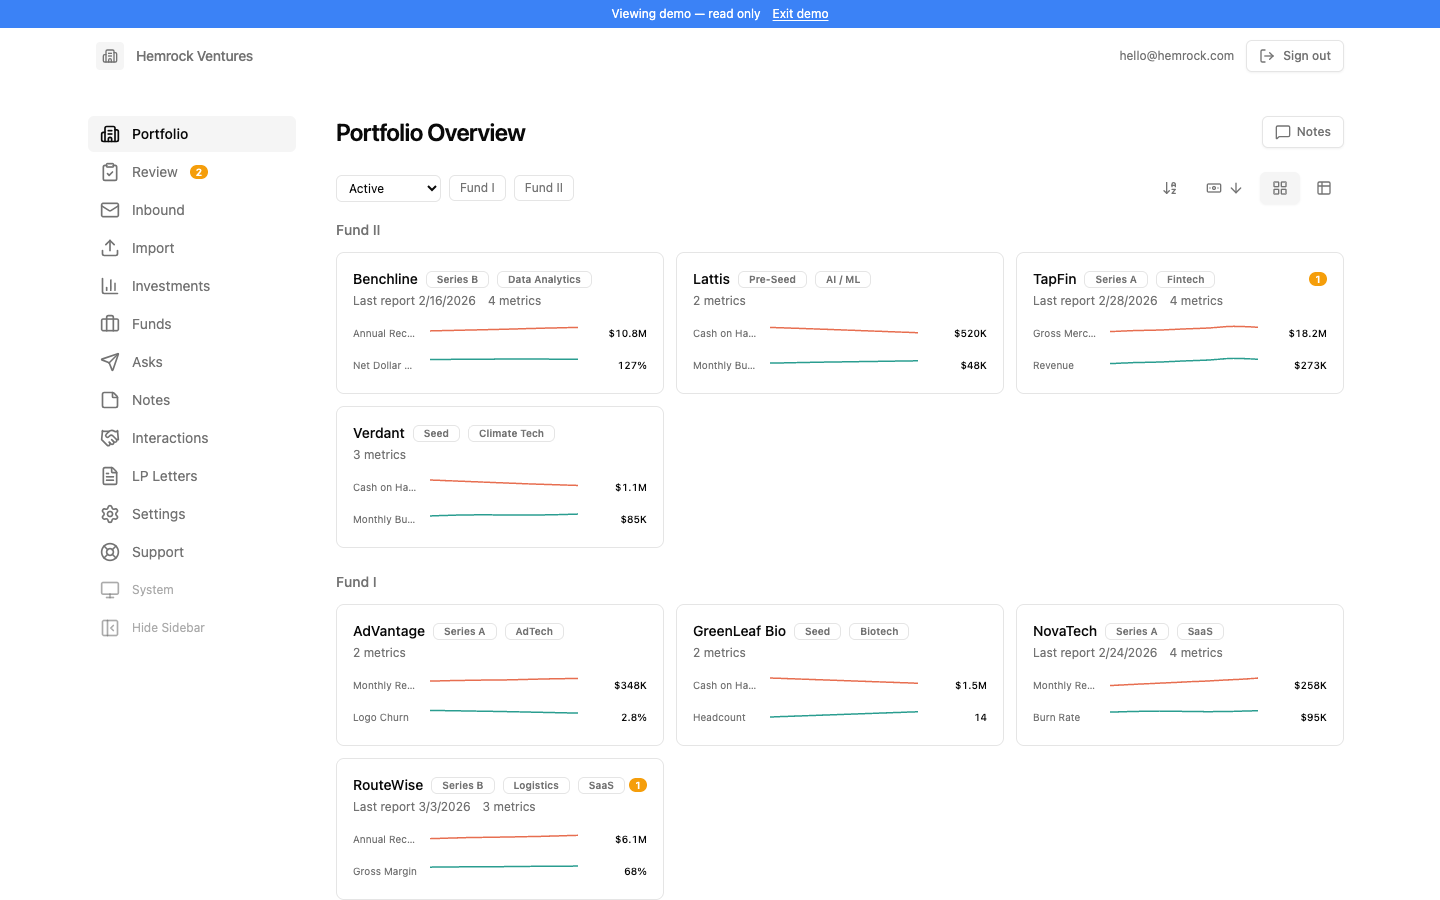
The Portfolio page is the main dashboard and your starting point for monitoring the fund. It shows all active companies with key headline metrics (such as MRR and cash balance) so you can quickly scan the health of the portfolio without clicking into individual companies. Companies are displayed as cards with their most recently reported figures.
The dashboard also includes a shared notes section at the bottom where team members can post fund-level observations: market commentary, cross-portfolio themes, reminders for the next IC meeting, and so on. These notes are visible to everyone on the team.
Company detail
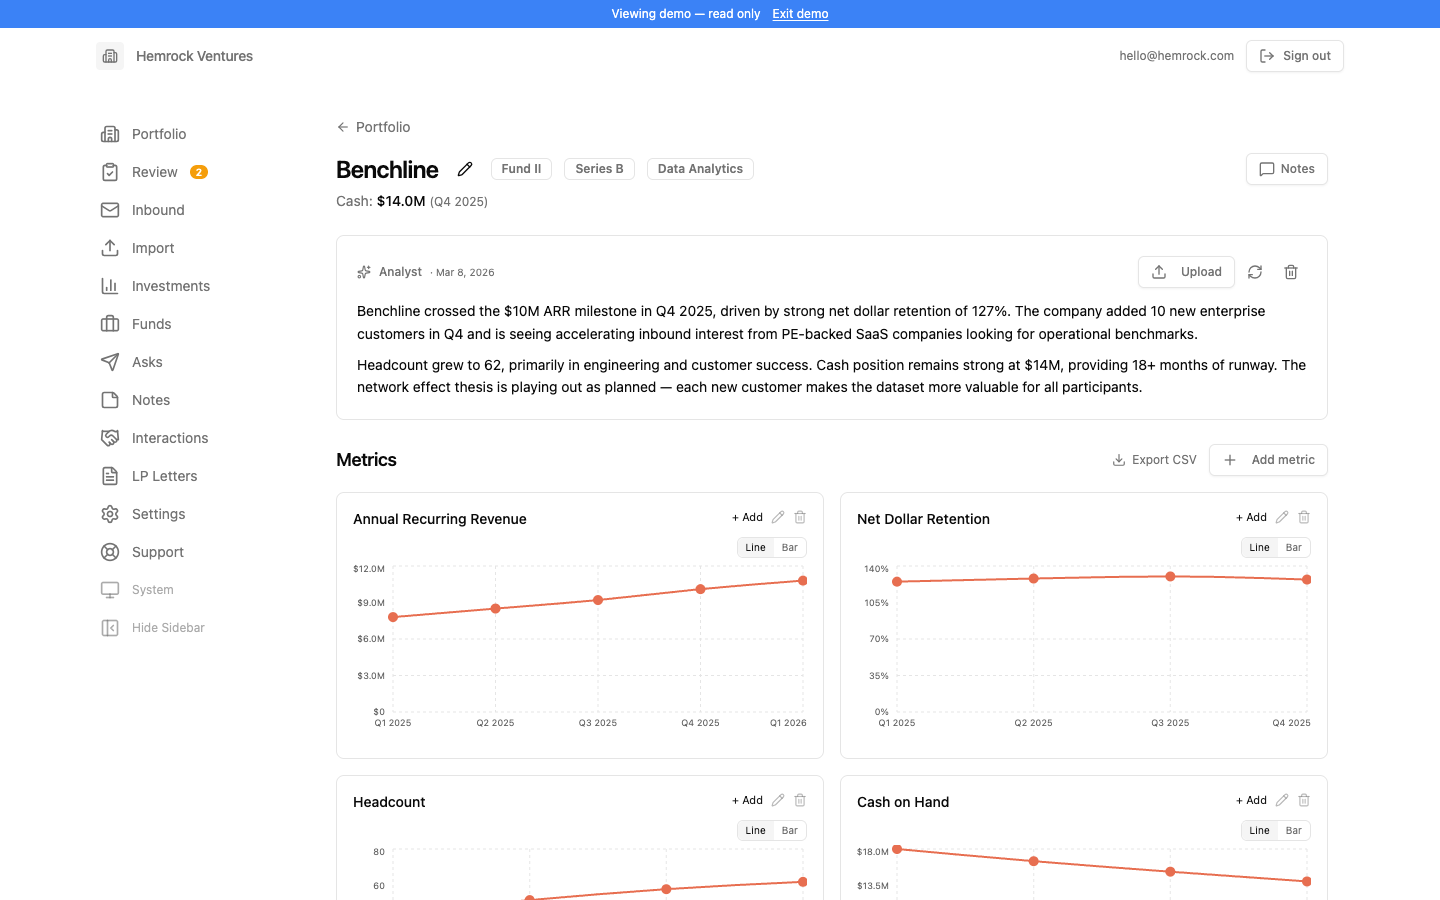
Clicking a company on the Portfolio dashboard opens its detail page. At the top you'll see the company name, headline metrics (like MRR and cash balance), and badges for stage, industry, and vehicles. Admins can click the edit button to update the company's name, aliases, stage, industry, founders, overview, and other details that give the AI more context for analysis.
The main content area starts with the Analyst card. This is where you can generate an AI-powered summary of the company based on all available data: reported metrics, email content, uploaded documents, and any previous summaries. The AI acts as a senior analyst preparing a portfolio review memo. It highlights current performance, trends, strengths, risks, and follow-up questions. You can regenerate the summary at any time as new data comes in, clear it to start fresh, or upload additional context documents (board decks, strategy memos, investor updates) directly from this card to give the AI more to work with. If your fund has multiple AI providers configured, a provider selector lets you choose which AI to use for each generation.
Below the Analyst is the metrics section, where each metric has its own chart card. You can add new metrics directly from this page using the "Add metric" button, or delete a metric and all its data from its card. Each chart shows data points over time, color-coded by confidence level (green for high, amber for medium, red for low) with manual entries shown as hollow circles. Click any data point on a chart to open a popover where you can view the full details (period, value, confidence, source email, and notes) and edit or delete the value directly. You can also add data points manually using the "Add" button on each card, which is useful for entering historical data or correcting values. An export button at the top lets you download all metric data as a CSV.
Further down the page, a documents section lists all files associated with the company (both files you've uploaded and attachments from processed emails). These documents are available to the Analyst when generating summaries. Individual file uploads are limited to 20 MB per file. Finally, if the company has additional details like founders, contact emails, an overview, investment thesis, or a current business update, those appear at the bottom. A notes panel on the right side (or toggled via the chat button on mobile) lets your team leave company-specific observations visible to all members.
The company page also includes an Investments section that tracks the fund's transaction history with that company. You can record investment rounds (with date, round name, amount invested, shares acquired, and cost per share), proceeds from exits or distributions (including escrowed amounts), and unrealized gain changes (current share price updates). The section displays summary metrics (total invested, current fair market value, MOIC, and total realized) along with a detailed transaction table. Admins can add, edit, and delete transactions directly from this panel. For exited companies the FMV reflects total realized proceeds; for written-off companies it shows zero; and for active companies it uses the latest share price multiplied by total shares held.
Investment tracking
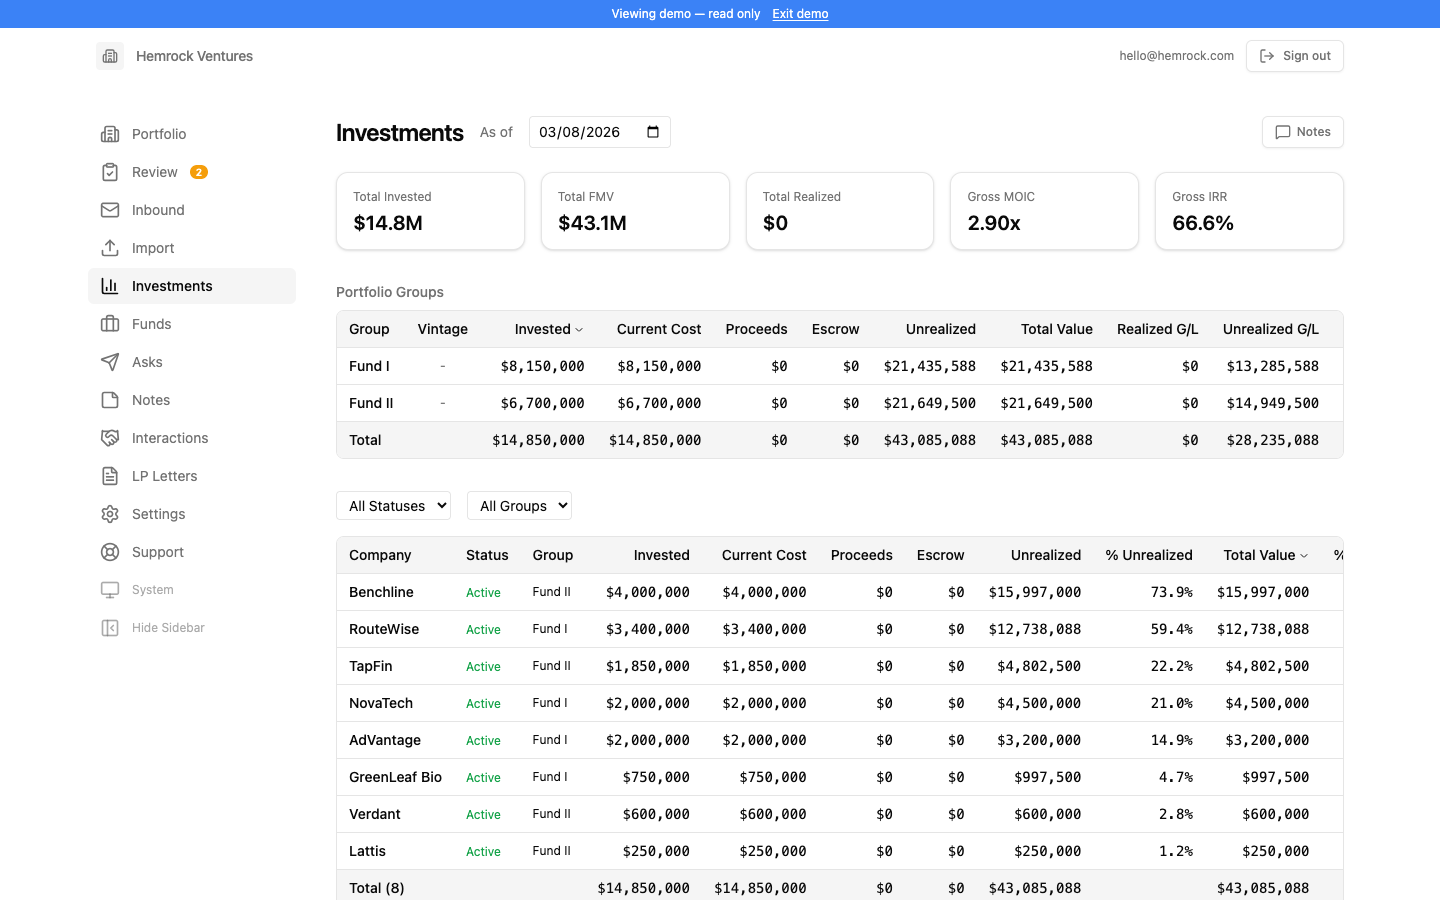
The Investments page provides a fund-level view of all investment transactions across your portfolio. It aggregates data from each company's individual Investments section into a single table, showing total invested, current fair market value (FMV), MOIC, and total realized across the entire fund.
On each company detail page, the Investments section tracks the fund's transaction history with that specific company. You can record investment rounds (with date, round name, amount invested, shares acquired, and cost per share), proceeds from exits or distributions (including escrowed amounts), and unrealized gain changes (current share price updates). Summary metrics (total invested, current FMV, MOIC, and total realized) are displayed above the transaction table.
Admins can add, edit, and delete transactions directly. For exited companies the FMV reflects total realized proceeds; for written-off companies it shows zero; and for active companies it uses the latest share price multiplied by total shares held. Investment data can also be bulk-imported via the Import page by pasting transaction data from a spreadsheet.
How data gets in
Inbound email
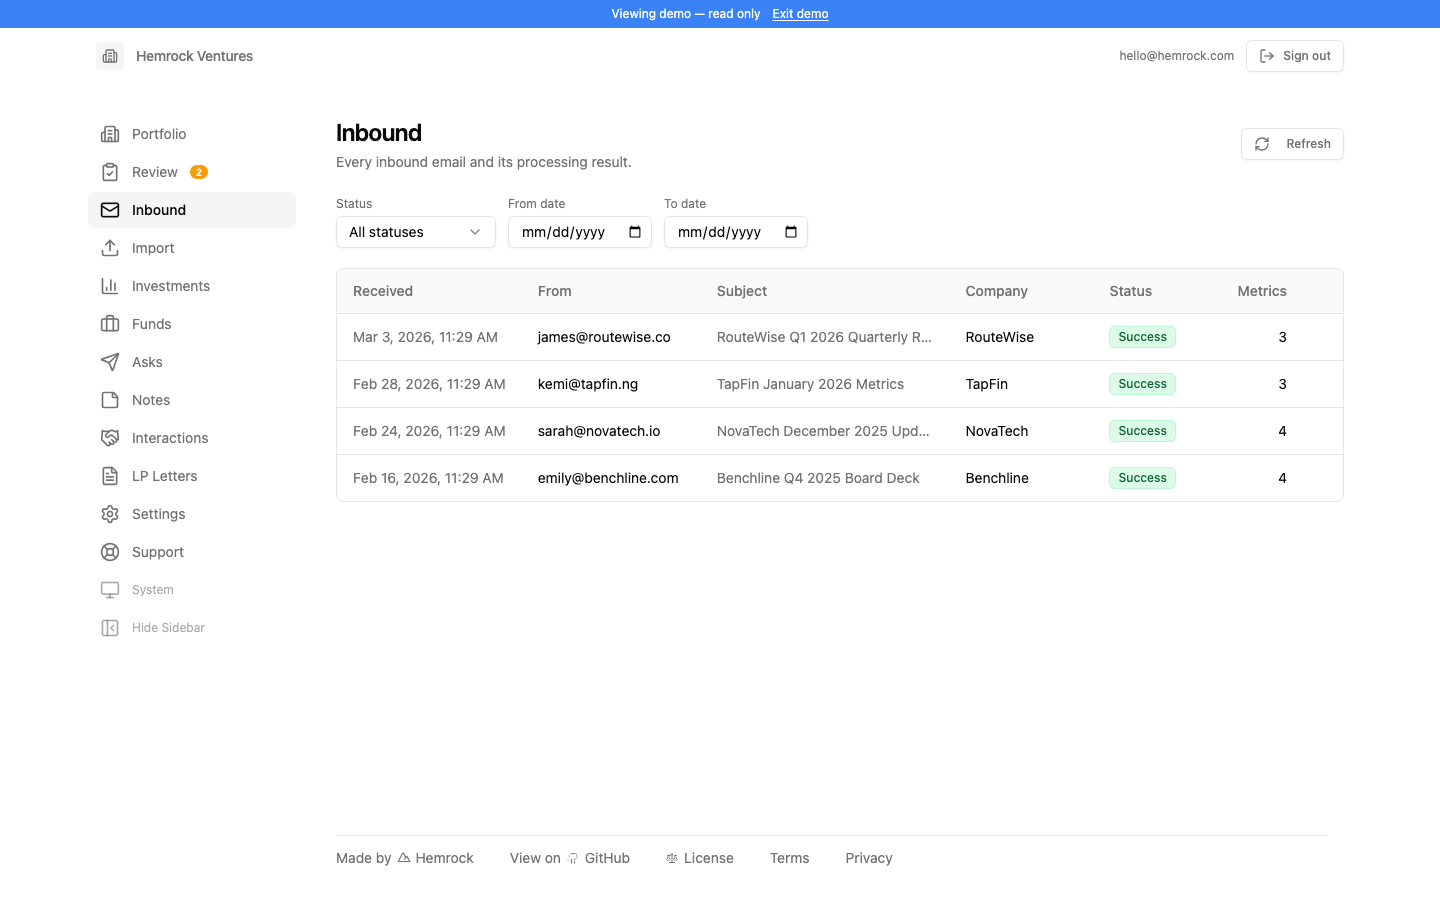
Inbound shows every email that has been received and processed by the system. It's the audit trail for all automated report ingestion. Each row displays the sender, subject line, which company the email was matched to, and the processing status (success, needs review, failed, processing, or pending).
You can filter the list by status and date range to quickly find specific emails. Filters apply immediately as you change them. The list is paginated and sorted by most recent first, so new emails always appear at the top.
Clicking on any email opens its detail view. There you'll see the full processing result: which company was identified, which metrics were extracted and their values, the reporting period that was detected, and any review items that were created. The raw email body and attachment information are also available for reference.
If an email failed processing (for example, the AI key was misconfigured or the email content was unreadable), you can see the error message in the detail view. For emails stuck in "needs review," you can open the review modal directly from the Inbound page to resolve flagged items without navigating to the Review queue.
The platform can also store documents for you automatically. If your admin has connected Google Drive in Settings, every inbound email and its attachments are saved into company-specific folders (organized by company name) so you always have the original source files alongside the extracted data.
Spreadsheet import
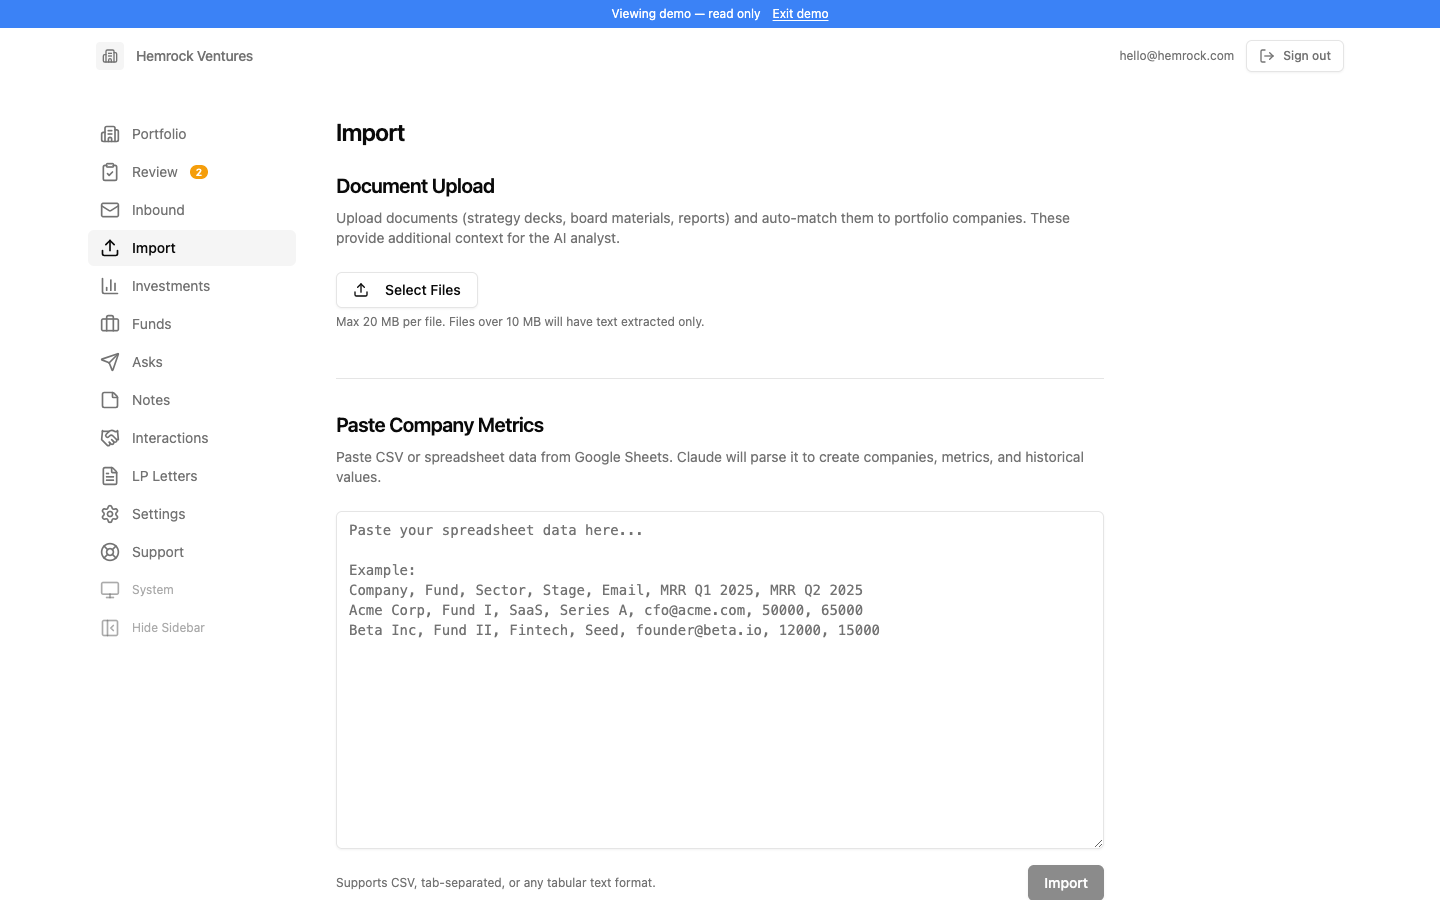
Import lets you process reports manually when they arrive outside the normal email flow. You can paste email text directly, upload file attachments (PDFs, Excel spreadsheets, Word documents, PowerPoint decks, CSV files, and images up to 20 MB each), or combine both. The system runs the same AI pipeline as automated inbound processing: identifying the company, extracting metrics, and writing results to the database.
This is useful for several scenarios: reports received through Slack or other messaging tools, historical data you want to backfill from older files, reports forwarded from colleagues outside the authorized sender list, or situations where you want to re-extract data from a document with updated metrics definitions.
When you submit an import, the system processes it identically to an inbound email. The result appears in the Inbound list with the same status tracking, and any flagged items show up in the Review queue. You can import multiple reports in sequence without waiting for each one to finish.
You can also paste data that covers multiple companies at once (for example, rows copied from a spreadsheet or CSV file containing metrics across your portfolio). The system will parse the data, create new companies if they don't already exist, add new metrics as needed, and populate values for existing companies and metrics. This makes it easy to bulk import historical data or onboard an entire portfolio in one step.
Additionally, you can paste investment transaction data (rounds, proceeds, valuations, and share prices), and the AI will parse the entries and match them to your portfolio companies. This is useful for bulk-importing cap table history, backfilling historical rounds, or onboarding an entire portfolio's investment data at once. Transactions are written to each company's Investments section automatically.
Fund-level cash flows (commitments, capital calls, and distributions per vehicle) come from the fund accounting feature, not from a paste import here. In accounting you post them as journal entries, or paste in journal entries or a bank or spreadsheet export. The same figures power the computed LP metrics (TVPI, DPI, RVPI, Net IRR) shown on the Investments page.
Tip: for best results, include the company name and reporting period somewhere in the pasted text or attachment. The AI uses these cues to match the report to the correct company and assign the right period to extracted metrics.
Asks
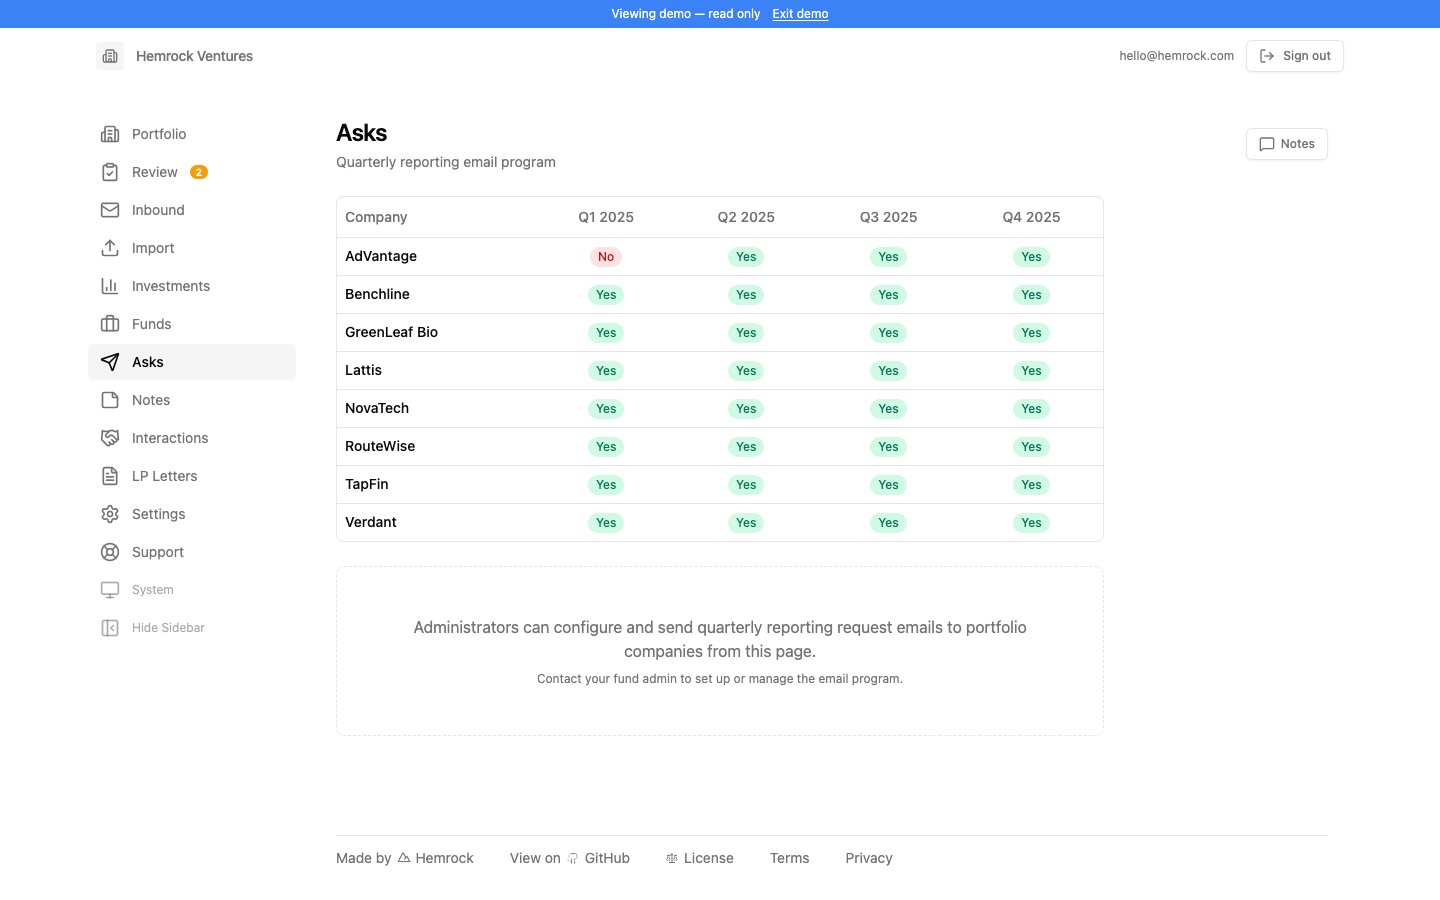
Asks lets you send reporting request emails to your portfolio companies. This is how you kick off a reporting cycle. Compose a message asking companies to send in their latest numbers, select which companies should receive it, and send it out. The system tracks each request so you know what was sent and when.
The email composer supports a customizable subject and HTML body. You can write a standard template that you reuse each quarter, or tailor messages for specific companies. Emails are sent through whichever outbound email provider your admin has configured (Gmail, Resend, Postmark, or Mailgun).
Each request is logged with its recipient list, send timestamp, and delivery results. You can view past requests to see the full history of reporting asks. This is helpful for tracking which companies have been contacted and following up with those that haven't responded.
When companies reply to your ask email with their report, those replies flow into the Inbound pipeline automatically (assuming the sender is on the authorized senders list and replies to the configured inbound address). The full loop (ask, receive, parse, review) is designed to work end to end with minimal manual effort.
Review queue
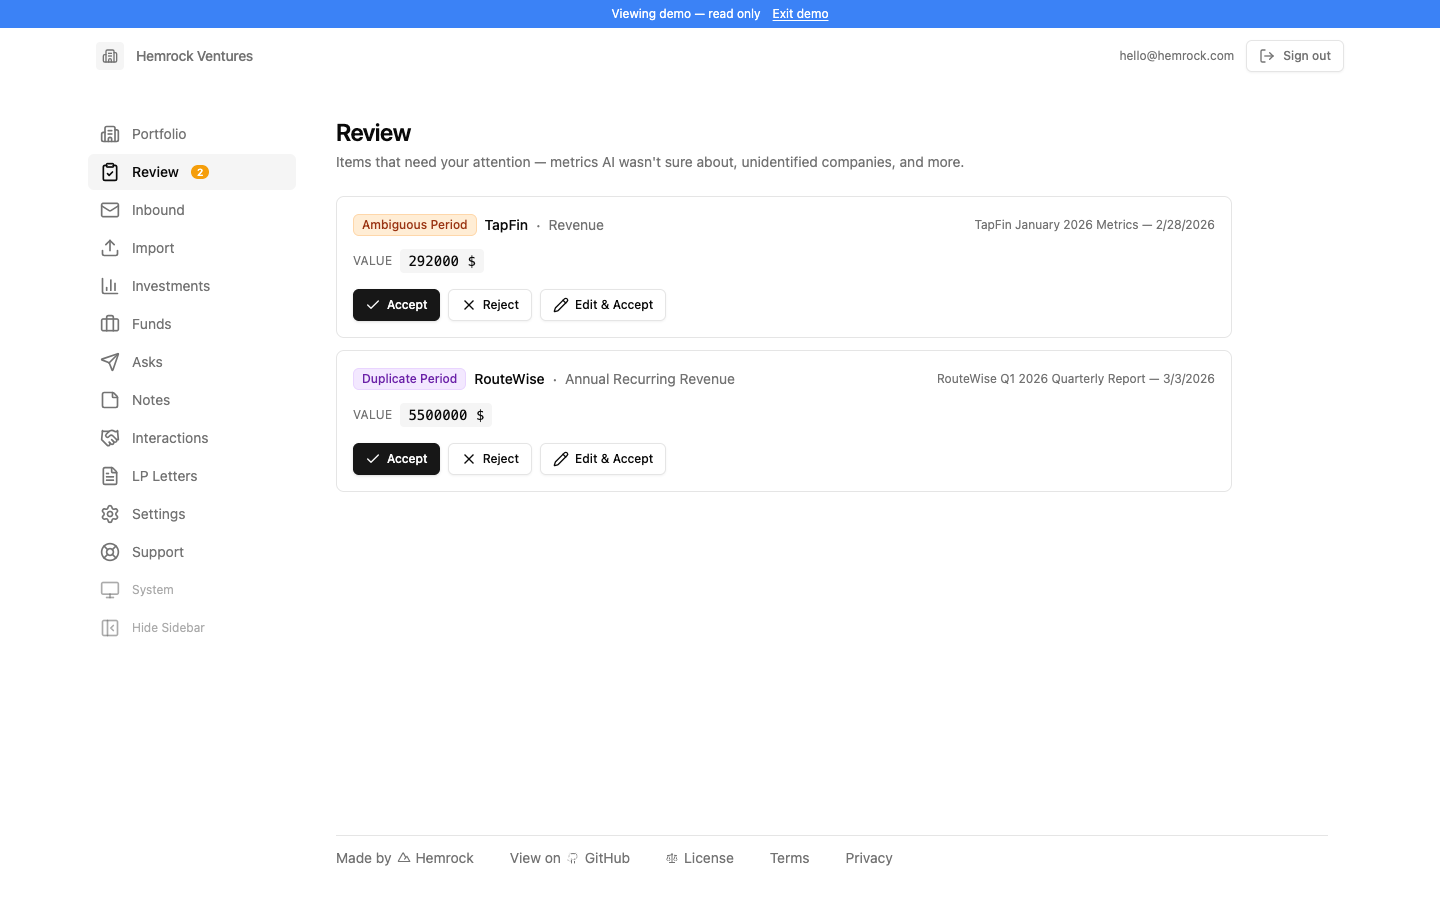
When inbound emails are processed, the AI pipeline sometimes flags items that need a human decision. These flagged items appear in the Review queue. Common reasons include: a new company name was detected that doesn't match any existing portfolio company, a metric value was extracted with low confidence, a reporting period was ambiguous, or a metric couldn't be found in the report at all.
Each review item shows you the issue type, the extracted value (if any), and a snippet of context from the source email so you can make an informed decision. You can accept the extracted value as-is, reject it, or manually correct it with the right number. For new company detections, you can create the company or map it to an existing one.
The review badge in the sidebar shows how many items are waiting for attention. Once all review items for a given email are resolved, that email's status automatically moves from "needs review" to "success." You can also dismiss all review items for an email at once if the entire report should be skipped.
Staying on top of the review queue is important. It's how you ensure the data flowing into your portfolio metrics is accurate. The system is designed to err on the side of flagging rather than silently writing bad data.
Notes
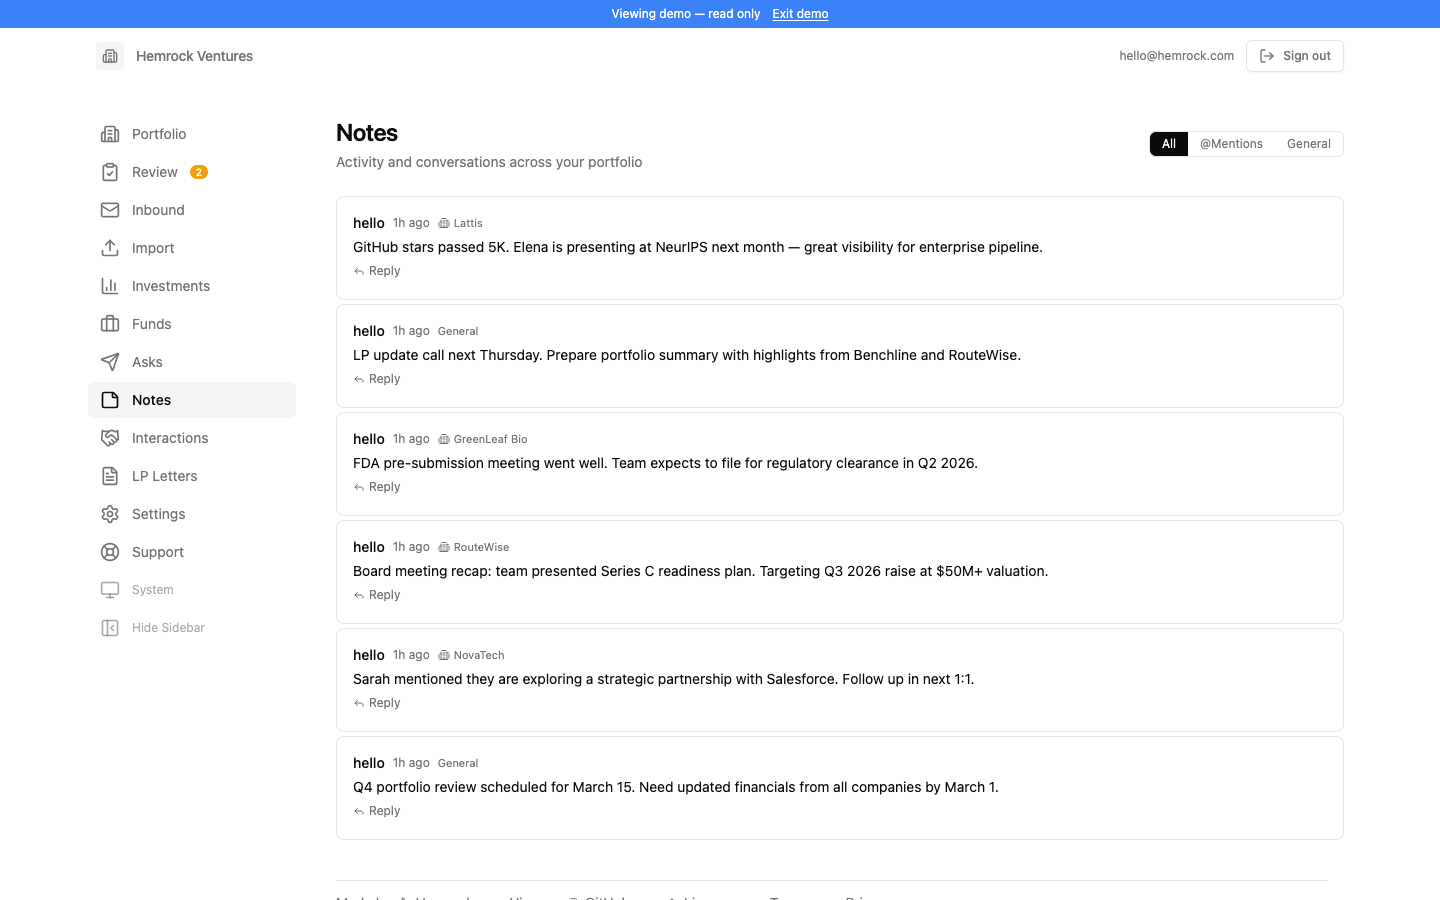
Notes are available in three places: on each company's detail page, on the Portfolio dashboard, and on the dedicated Notes page. They provide a lightweight way for team members to share observations, context, and follow-up items without leaving the platform.
On a company detail page, the notes panel appears on the right side on desktop or can be toggled via a chat button on mobile. Notes here are specific to that company: use them for takeaways from founder calls, questions to raise at the next board meeting, context on a metric anomaly, or anything else your team should know about that particular investment. On the Portfolio dashboard, the shared notes section is for fund-level observations that apply across the portfolio: market trends, cross-company themes, reminders for the next investment committee, or general team updates.
The Notes page is a centralized feed that collects all notes across the fund in one place. You can filter by All notes, General (fund-level) notes, or just notes where you were @mentioned. Each note shows the author, timestamp, and which company it belongs to (if any), with unread notes highlighted so you can quickly catch up on what you've missed.
Notes support @mentions. Type @ while writing a note to see a dropdown of team members, then select a name to mention them. Mentioned team members are highlighted in the note text and can receive email notifications depending on their preferences.
You can also follow companies to stay informed about notes posted on companies you care about, even if you aren't directly mentioned. When someone posts a note on a company you follow, you'll receive a notification.
Notification preferences are managed in Settings under your user profile. You can choose to receive email notifications for all notes across the fund, only when you are @mentioned, or turn notifications off entirely. Company follows work alongside whichever level you choose: if you follow a company, you'll get notified about notes on that company regardless of your global setting.
All notes show the author's display name and timestamp. Team members can edit or delete their own notes. Notes are visible to everyone on the team, so they work well as a lightweight internal communication tool alongside your existing workflows.
Interactions
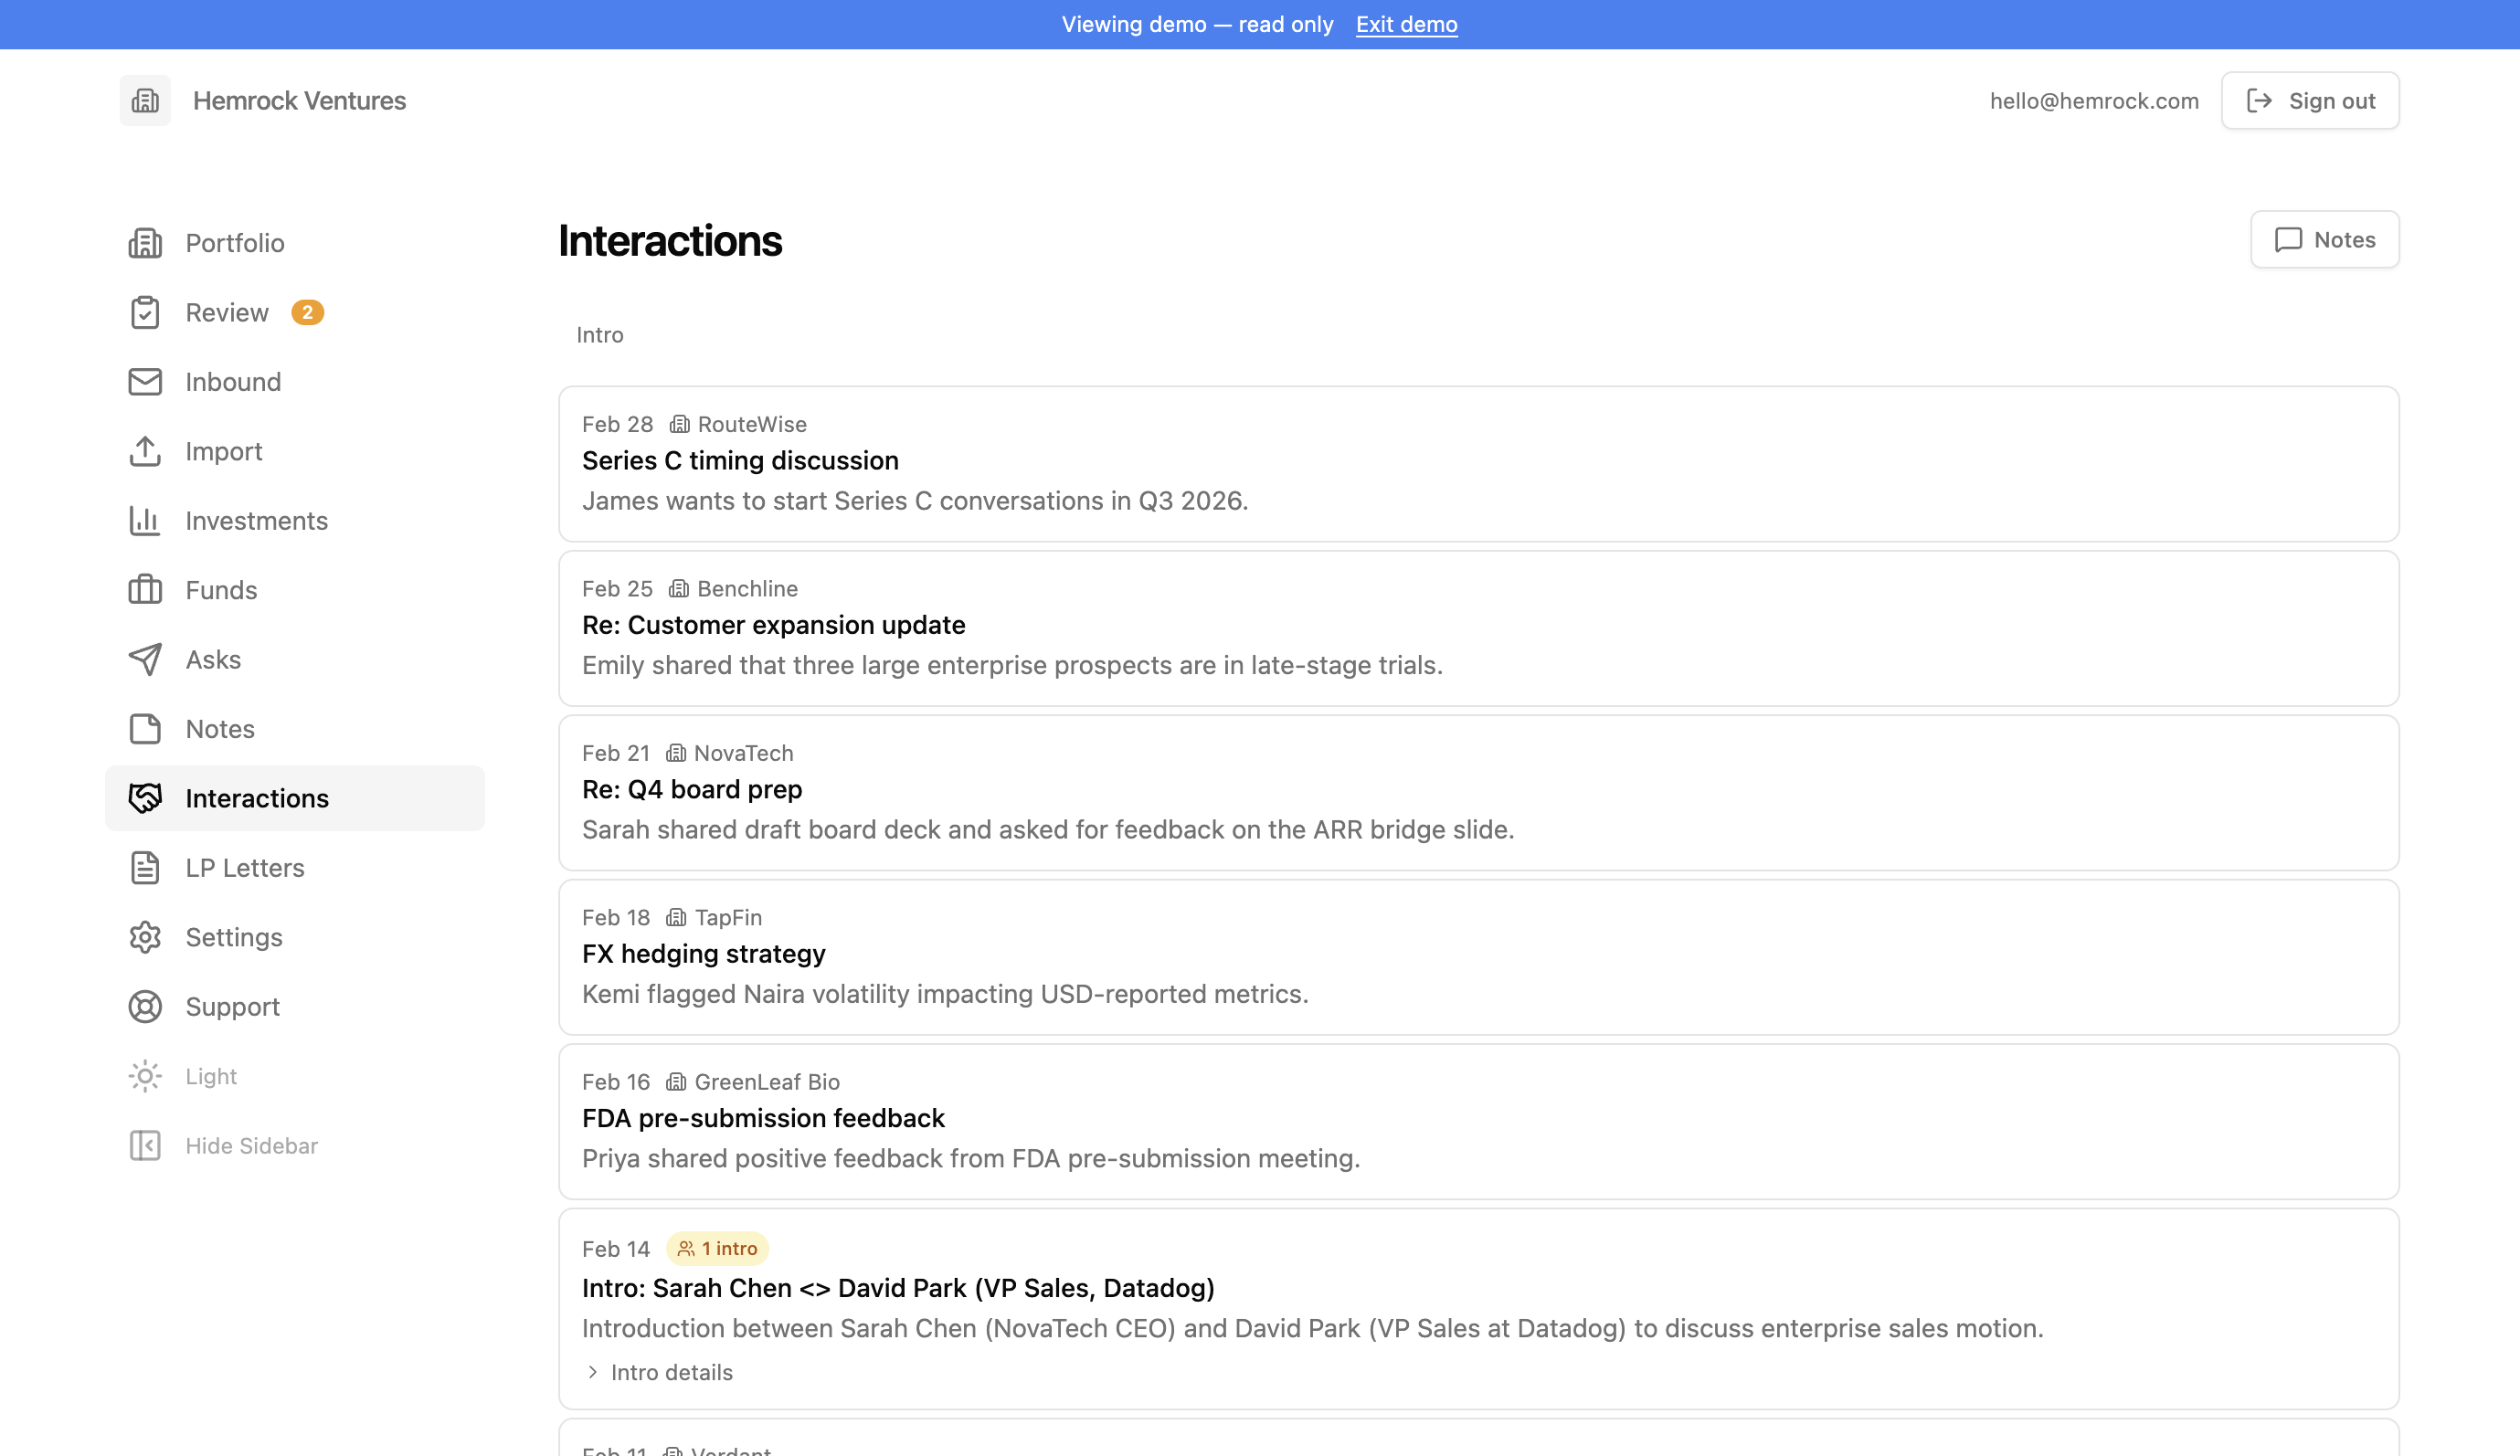
Interactions gives GPs a searchable log of all conversations and introductions with portfolio companies. When a GP BCCs the fund's inbound email address on a conversation, the system automatically detects that the sender is a fund member, classifies the email as a CRM interaction (not a metrics report), and uses AI to extract a summary and identify any introductions.
The classification is automatic. Emails from fund members are routed to the interaction pipeline, while emails from authorized senders (portfolio companies) continue through the existing metrics extraction pipeline. No manual tagging is required.
For each interaction, the AI generates a short summary, detects whether the email contains an introduction between parties, and extracts the names and context of anyone being introduced. Interactions are linked to portfolio companies when possible, so you can see all conversations related to a specific company.
The Interactions page shows all logged interactions across the fund, with filter tabs for All and Intros. Each entry shows the date, linked company, subject line, AI summary, and an intro badge when introductions were detected. Click the intro details to expand and see the names, emails, and context of introduced contacts.
On each company's detail page, a Recent Interactions section shows the latest interactions for that company, with intro entries highlighted in a distinct style. A "View all" link takes you to the full interactions list filtered to that company.
The fund's inbound email address is displayed at the top of the Interactions page for easy reference and can be copied with one click. Simply BCC this address on any email conversation you want to log.