Prompt to build a Runway Tool
Driver-based revenue and costs, three linked statements, cash and months of runway. Paste the prompt into Claude, ChatGPT or Gemini, answer its questions, and it builds the workbook with the same structure as my Runway Tool.
Or get the finished model
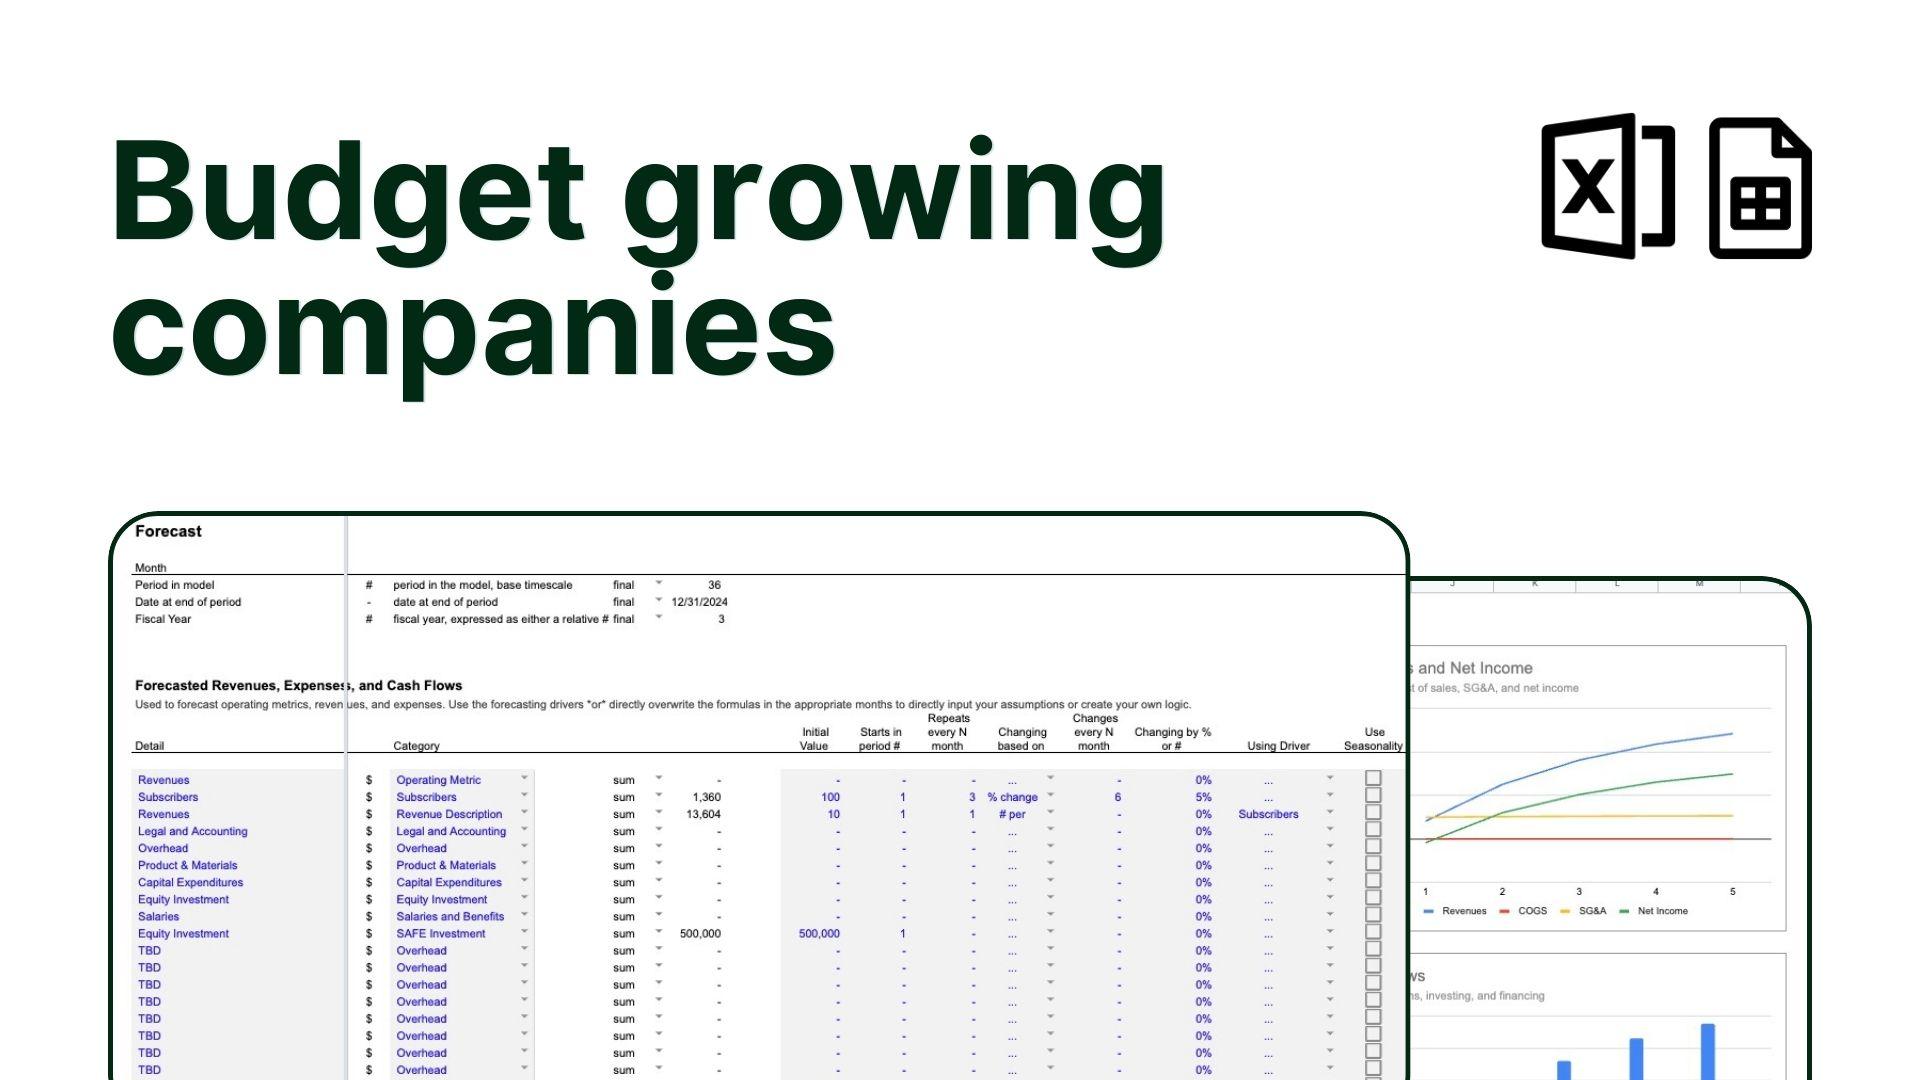
Runway Tool
Built and tested, for Excel and Google Sheets. $20 suggested, pay what you want.
How to use it
You need an AI that hands back a real spreadsheet file, not a description of one. Here’s where that lives in each:
- Claude creates .xlsx files on every plan, free included, and it’s on by default. If it only describes the workbook, open Settings, then Capabilities, and turn on “Code execution and file creation” (called “Create and edit files” in newer versions). On a Team or Enterprise plan your admin controls it.
- ChatGPT has no switch to find. Ask for the workbook as an .xlsx file and it gives you a download link. A paid plan copes better with a model this size.
- Gemini builds working spreadsheets inside Google Sheets: open a blank sheet, click the Gemini icon in the side panel and paste the prompt there. That needs a Google AI Pro or Ultra plan or a Workspace plan with Gemini.
The prompt opens with a few questions about your business. Answer them, or tell it to use the defaults and see the model working before you put your own numbers in.
When it’s done, open the workbook and read the model checks before you trust a number. An AI that builds a model from a prompt still makes mistakes, and the checks are there to catch them. If you want a second pair of eyes on it, that’s what a working session is for.
The prompt
You are an experienced startup CFO. Build me a monthly runway and cash forecast in a spreadsheet. I enter each revenue, expense and funding line once with a simple driver, and the model builds the income statement, balance sheet and cash flow statement from it, then tells me how many months of cash I have. Keep it lean: this is a cost-focused tool for an early company, not a full operating model.

## Before you build

Ask me these questions first, in one message, and wait for my answers. If I say "use the defaults", use the defaults below.

1. How much cash do you have today, and are you raising money soon (how much, when, as equity or a SAFE)?
2. What are your revenue streams, what does each bring in a month now, and how fast is each growing?
3. What do you spend a month, by line (people, software, rent, marketing, contractors), and what will change and when?
4. Do customers pay upfront or on terms, and do you pay suppliers on terms?
5. Do you hold inventory or buy equipment?

## Workbook structure

- **Get Started**: setup, balance sheet assumptions, seasonality and model checks.
- **Forecast**: one row per revenue, expense and funding line with its driver inputs, then totals by category, then the supporting schedules (working capital, depreciation, taxes).
- **Statements**: income statement, balance sheet and cash flow statement, stacked on one sheet with the same monthly columns as the Forecast.
- **Summary**: the statements rolled up by fiscal year, plus runway.
- **Key Reports**: charts only.

## Inputs (Get Started)

| Section | Input | Default |
| --- | --- | --- |
| Setup | Company name, currency symbol | Company, $ |
| | Months in the model | 36 |
| | First month (period end date) | Jan of next year |
| | Fiscal year end month | December |
| Balance sheet | Cash on hand at the start | $0 |
| | Days of accounts receivable | 0 |
| | Prepaid expenses, accounts payable and accrued liabilities, each as % of SG&A | 0%, 0%, 0% |
| | Depreciation, straight-line months | 36 |
| | Corporate income tax rate, and payment schedule (monthly, quarterly, annually) | 21%, quarterly |
| | Inventory: months of lead time, safety stock % of COGS, % paid at purchase, days until the rest is paid | 0, 0%, 100%, 0 |
| Seasonality | % change for each calendar month, January to December (should sum to 0) | 0% each |

## The Forecast sheet and its drivers

Each line on the Forecast is one row. Columns, left to right: label, notes, category (dropdown), then the driver inputs, then one column per month.

Categories: Equity investment, SAFE or convertible note, Debt financing, Revenue, Cost of sales, R&D, Sales and marketing, G&A, Other SG&A, Capital expenditure, Interest, Other income or expense, and Metric (a non-financial driver such as subscribers, excluded from the statements).

Driver inputs for each row:
- Initial value.
- Starts in month number.
- Repeats every N months (1 = every month; 0 = once).
- Changing based on (dropdown): none, % change, # change, % of another row, # per another row.
- Changes every N months.
- Change amount (the % or #).
- Driver row (the label of another row, used by "% of" and "# per"; look it up with INDEX/MATCH so rows can be reordered).
- Use seasonality (TRUE or FALSE).

The monthly cells are one formula, copied across every row, that applies those drivers. No typed numbers in the monthly area. Leave a few empty template rows in each section and a marker row that says "Insert new rows above this line" so the totals pick up new rows.

Starting rows with defaults: an equity investment of $500,000 as a SAFE in month 1; a revenue stream of $5,000 a month from month 1; a "Subscribers" metric starting at 100 and growing 5% a month; a second revenue stream at $5 per subscriber; and one row each for R&D, sales and marketing, G&A, other SG&A and cost of sales, at zero for me to fill in.

Totals by category: one row per category, using SUMIFS on the category column, so every line lands in exactly one place.

## Statements

Income statement: revenue and % growth, cost of sales, gross margin and %, SG&A (R&D, sales and marketing, G&A, other) and % of revenue, EBITDA and %, depreciation, interest, other income and expense, earnings before taxes, taxes, net income, cumulative net income.

Balance sheet: cash, accounts receivable, inventory, prepaid expenses, PP&E less accumulated depreciation, total assets; accounts payable, accrued liabilities, deferred revenue, taxes payable, total current liabilities; SAFEs and convertible notes, debt; equity investment, retained earnings, net income, total equity; total liabilities and equity; and a check row.

Cash flow statement: cash at the beginning; net income, plus depreciation, plus or minus each change in working capital; capital expenditure; equity, SAFE and debt raised, less debt repaid; net cash flow; cash at the end. Cash at the end is the balance sheet's cash line.

Supporting schedules on the Forecast: accounts receivable from days receivable, prepaid, payables and accruals as a percent of SG&A, depreciation of each month's capital expenditure straight-line, taxes accrued on positive cumulative earnings and paid on the schedule, and inventory purchases from lead time and safety stock if inventory is used.

## Runway

On the Summary, and repeated at the top of the Forecast:
- Net burn per month = negative net cash flow, excluding funding.
- Average net burn over the last 3 months.
- Months of runway = cash at the end ÷ average net burn (show "Cash flow positive" when burn is zero or negative).
- The first month cash goes below zero, if it does.

The Summary also rolls the three statements up by fiscal year with SUMIFS, using year-end balances for the balance sheet, and adds a sources and uses table: total funding and revenue against each expense category and working capital, in dollars and as a percent of the total.

## Key Reports

Charts: cash at the end of each month with the zero line; revenue against total expenses; net burn by month; expenses by category, stacked.

## Model checks

On Get Started, each returning TRUE or FALSE: the balance sheet balances in every month; cash stays above zero; deferred revenue, inventory and PP&E never go negative; seasonality sums to 0%.

## How the workbook should look and behave

These are my house rules for spreadsheets. Follow all of them.

- Use Arial 12 everywhere, including the workbook's default style. Never Calibri.
- Inputs are blue text (#0000FF) on a light grey fill (#F2F2F2), so they read like form fields. Calculations are black text with no fill. Never use grey text anywhere.
- Every sheet leaves column A blank and narrow. The model starts in column B.
- Column B holds row labels. Column C is a narrow Notes column, about half the width of the label column, holding a short note on what the row is or where it comes from. Let notes clip rather than wrap. Values, or the first period of a timeline, start after the notes column.
- No cell comments. Notes go in the notes column.
- Turn gridlines off on every sheet. Freeze panes on the header rows only, never on columns.
- No borders at all, not even header underlines or subtotal rules. Blank rows and bold text carry the structure.
- Every calculated number is a live formula that traces back to an input. Never type a number into a calculation cell, and never mix typed values and formulas in the same row.
- Keep the number of sheets low. Sheets that share a timeline use the same columns, so a given column is the same month on every sheet.
- Format currency with thousands separators and no decimals, percentages with one decimal place, and dates as "mmm yyyy".
- Name rows in plain words a founder or investor would use, with units in the label where it helps ("Churn per contract cycle, %").

## When you're done

- Recalculate and confirm there are no errors (#REF!, #DIV/0!, #VALUE!, #N/A) and no circular references unless I asked for one.
- Show me the results of the model checks and the headline outputs.
- List every assumption you made that I didn't give you, and the three inputs I should change first.
- If you can't produce an .xlsx file, give me each sheet as a table with the exact label, input value or formula in every cell, so I can rebuild it in Excel or Google Sheets without guessing.